November 8, 2016, 9:30 am
Today the CNCF is pleased to launch a new training, certification and Kubernetes Managed Service Provider (KMSP) program. The goal of the program is to ensure enterprises get the support they’re looking for to get up to speed and roll out new applications more quickly and more efficiently. The Linux Foundation, in partnership with CNCF, will develop and operate the Kubernetes training and certification.
Interested in this course? Sign up here to pre-register. The course, expected to be available in early 2017, is open now at the discounted price of $99 (regularly $199) for a limited time, and the certification program is expected to be available in the second quarter of 2017. The KMSP program is a pre-qualified tier of highly vetted service providers who have deep experience helping enterprises successfully adopt Kubernetes. The KMSP partners offer SLA-backed Kubernetes support, consulting, professional services and training for organizations embarking on their Kubernetes journey. In contrast to the Kubernetes Service Partners program outlined recently in this blog, to become a Kubernetes Managed Service Provider the following additional requirements must be met: three or more certified engineers, an active contributor to Kubernetes, and a business model to support enterprise end users. As part of the program, a new CNCF Certification Working Group is starting up now. The group will help define the program's open source curriculum, which will be available under the Creative Commons By Attribution 4.0 International license for anyone to use. Any Kubernetes expert can join the working group via this link. Google has committed to assist, and many others, including Apprenda, Container Solutions, CoreOS, Deis and Samsung SDS, have expressed interest in participating in the Working Group.To learn more about the new program and the first round of KMSP partners that we expect to grow weekly, check out today's announcement here.
↧
November 17, 2016, 3:55 pm
In Kubernetes 1.4, we introduced a new node performance analysis tool, called the node performance dashboard, to visualize and explore the behavior of the Kubelet in much richer details. This new feature will make it easy to understand and improve code performance for Kubelet developers, and lets cluster maintainer set configuration according to provided Service Level Objectives (SLOs).Background
A Kubernetes cluster is made up of both master and worker nodes. The master node manages the cluster’s state, and the worker nodes do the actual work of running and managing pods. To do so, on each worker node, a binary, called Kubelet, watches for any changes in pod configuration, and takes corresponding actions to make sure that containers run successfully. High performance of the Kubelet, such as low latency to converge with new pod configuration and efficient housekeeping with low resource usage, is essential for the entire Kubernetes cluster. To measure this performance, Kubernetes uses end-to-end (e2e) tests to continuously monitor benchmark changes of latest builds with new features.
Kubernetes SLOs are defined by the following benchmarks:
* API responsiveness: 99% of all API calls return in less than 1s.* Pod startup time: 99% of pods and their containers (with pre-pulled images) start within 5s.
Prior to 1.4 release, we’ve only measured and defined these at the cluster level, opening up the risk that other factors could influence the results. Beyond these, we also want to have more performance related SLOs such as the maximum number of pods for a specific machine type allowing maximum utilization of your cluster. In order to do the measurement correctly, we want to introduce a set of tests isolated to just a node’s performance. In addition, we aim to collect more fine-grained resource usage and operation tracing data of Kubelet from the new tests.Data Collection
The node specific density and resource usage tests are now added into e2e-node test set since 1.4. The resource usage is measured by a standalone cAdvisor pod for flexible monitoring interval (comparing with Kubelet integrated cAdvisor). The performance data, such as latency and resource usage percentile, are recorded in persistent test result logs. The tests also record time series data such as creation time, running time of pods, as well as real-time resource usage. Tracing data of Kubelet operations are recorded in its log stored together with test results.Node Performance Dashboard
Since Kubernetes 1.4, we are continuously building the newest Kubelet code and running node performance tests. The data is collected by our new performance dashboard available at node-perf-dash.k8s.io. Figure 1 gives a preview of the dashboard. You can start to explore it by selecting a test, either using the drop-down list of short test names (region (a)) or by choosing test options one by one (region (b)). The test details show up in region (c) containing the full test name from Ginkgo (the Go test framework used by Kubernetes). Then select a node type (image and machine) in region (d).![]() |
| Figure 1. Select a test to display in node performance dashboard. |
The "BUILDS" page exhibits the performance data across different builds (Figure 2). The plots include pod startup latency, pod creation throughput, and CPU/memory usage of Kubelet and runtime (currently Docker). In this way it’s easy to monitor the performance change over time as new features are checked in.
![]() |
| Figure 2. Performance data across different builds. |
Compare Different Node ConfigurationsIt’s always interesting to compare the performance between different configurations, such as comparing startup latency of different machine types, different numbers of pods, or comparing resource usage of hosting different number of pods. The dashboard provides a convenient way to do this. Just click the "Compare it" button the right up corner of test selection menu (region (e) in Figure 1). The selected tests will be added to a comparison list in the "COMPARISON" page, as shown in Figure 3. Data across a series of builds are aggregated to a single value to facilitate comparison and are displayed in bar charts.
![]() |
| Figure 3. Compare different test configurations. |
Time Series and Tracing: Diving Into Performance Data
Pod startup latency is an important metric for Kubelet, especially when creating a large number of pods per node. Using the dashboard you can see the change of latency, for example, when creating 105 pods, as shown in Figure 4. When you see the highly variable lines, you might expect that the variance is due to different builds. However, as these test here were run against the same Kubernetes code, we can conclude the variance is due to performance fluctuation. The variance is close to 40s when we compare the 99% latency of build #162 and #173, which is very large. To drill into the source of the fluctuation, let’s check out the "TIME SERIES" page.
![]() |
| Figure 4. Pod startup latency when creating 105 pods. |
Looking specifically at build #162, we are able to see that the tracing data plotted in the pod creation latency chart (Figure 5). Each curve is an accumulated histogram of the number of pod operations which have already arrive at a certain tracing probe. The timestamp of tracing pod is either collected from the performance tests or by parsing the Kubelet log. Currently we collect the following tracing data:
- "create" (in test): the test creates pods through API client;
- "running" (in test): the test watches that pods are running from API server;
- "pod_config_change": pod config change detected by Kubelet SyncLoop;
- "runtime_manager": runtime manager starts to create containers;
- "infra_container_start": the infra container of a pod starts;
- "container_start': the container of a pod starts;
- "pod_running": a pod is running;
- "pod_status_running": status manager updates status for a running pod;
The time series chart illustrates that it is taking a long time for the status manager to update pod status (the data of "running" is not shown since it overlaps with "pod_status_running"). We figure out this latency is introduced due to the query per second (QPS) limits of Kubelet to the API server (default is 5). After being aware of this, we find in additional tests that by increasing QPS limits, curve "running" gradually converges with "pod_running', and results in much lower latency. Therefore the previous e2e test pod startup results reflect the combined latency of both Kubelet and time of uploading status, the performance of Kubelet is thus under-estimated.
![]() |
| Figure 5. Time series page using data from build #162. |
Further, by comparing the time series data of build #162 (Figure 5) and build #173 (Figure 6), we find that the performance pod startup latency fluctuation actually happens during updating pod statuses. Build #162 has several straggler "pod_status_running" events with a long latency tails. It thus provides useful ideas for future optimization.
![]() |
| Figure 6. Pod startup latency of build #173. |
In future we plan to use events in Kubernetes which has a fixed log format to collect tracing data more conveniently. Instead of extracting existing log entries, then you can insert your own tracing probes inside Kubelet and obtain the break-down latency of each segment.
You can check the latency between any two probes across different builds in the “TRACING” page, as shown in Figure 7. For example, by selecting "pod_config_change" as the start probe, and "pod_status_running' as the end probe, it gives the latency variance of Kubelet over continuous builds without status updating overhead. With this feature, developers are able to monitor the performance change of a specific part of code inside Kubelet.
![]() |
| Figure 7. Plotting latency between any two probes. |
Future Work
The
node performance dashboard is a brand new feature. It is still alpha version under active development. We will keep optimizing the data collecting and visualization, providing more tests, metrics and tools to the developers and the cluster maintainers.
Please join our community and help us build the future of Kubernetes! If you’re particularly interested in nodes or performance testing, participate by chatting with us in our
Slack channel or join our meeting which meets every Tuesday at 10 AM PT on this
SIG-Node Hangout.
--Zhou Fang, Software Engineering Intern, Google
↧
↧
November 18, 2016, 1:05 pm
Editor's note: Today’s post is by Stefan Thies, Developer Evangelist, at Sematext, showing key Kubernetes metrics and log elements to help you troubleshoot and tune Docker and Kubernetes.
Managing microservices in containers is typically done with Cluster Managers and Orchestration tools. Each container platform has a slightly different set of options to deploy containers or schedule tasks on each cluster node. Because we do container monitoring and logging at Sematext, part of our job is to share our knowledge of these tools, especially as it pertains to container observability and devops. Today we’ll show a tutorial for Container Monitoring and Log Collection on Kubernetes.Dynamic Deployments Require Dynamic MonitoringThe high level of automation for the container and microservice lifecycle makes the monitoring of Kubernetes more challenging than in more traditional, more static deployments. Any static setup to monitor specific application containers would not work because Kubernetes makes its own decisions according to the defined deployment rules. It is not only the deployed microservices that need to be monitored. It is equally important to watch metrics and logs for Kubernetes core services themselves, such as Kubernetes Master running etcd, controller-manager, scheduler and apiserver and Kubernetes Workers (fka minions) running kubelet and proxy service. Having a centralized place to keep an eye on all these services, their metrics and logs helps one spot problems in the cluster infrastructure. Kubernetes core services could be installed on bare metal, in virtual machines or as containers using Docker. Deploying Kubernetes core services in containers could be helpful with deployment and monitoring operations - tools for container monitoring would cover both core services and application containers. So how does one monitor such a complex and dynamic environment?Agent for Kubernetes Metrics and LogsThere are a number of open source docker monitoring and logging projects one can cobble together to build a monitoring and log collection system (or systems). The advantage is that the code is all free. The downside is that this takes times - both initially when setting it up and later when maintaining. That’s why we built Sematext Docker Agent - a modern, Docker-aware metrics, events, and log collection agent. It runs as a tiny container on every Docker host and collects logs, metrics and events for all cluster nodes and all containers. It discovers all containers (one pod might contain multiple containers) including containers for Kubernetes core services, if core services are deployed in Docker containers. Let’s see how to deploy this agent.Deploying Agent to all Kubernetes Nodes
Kubernetes provides DeamonSets, which ensure pods are added to nodes as nodes are added to the cluster. We can use this to easily deploy Sematext Agent to each cluster node!Configure Sematext Docker Agent for KubernetesLet’s assume you’ve created an SPM app for your Kubernetes metrics and events, and a Logsene app for your Kubernetes logs, each of which comes with its own token. The Sematext Docker Agent README lists all configurations (e.g. filter for specific pods/images/containers), but we’ll keep it simple here.- Grab the latest sematext-agent-daemonset.yml (raw plain-text) template (also shown below)
- Save it somewhere on disk
- Replace the SPM_TOKEN and LOGSENE_TOKEN placeholders with your SPM and Logsene App tokens
apiVersion: extensions/v1beta1
kind: DaemonSet
metadata:
name: sematext-agent
spec:
template:
metadata:
labels:
app: sematext-agent
spec:
selector: {}
dnsPolicy: "ClusterFirst"
restartPolicy: "Always"
containers:
- name: sematext-agent
image: sematext/sematext-agent-docker:latest
imagePullPolicy: "Always"
env:
- name: SPM_TOKEN
value: "REPLACE THIS WITH YOUR SPM TOKEN"
- name: LOGSENE_TOKEN
value: "REPLACE THIS WITH YOUR LOGSENE TOKEN"
- name: KUBERNETES
value: "1"
volumeMounts:
- mountPath: /var/run/docker.sock
name: docker-sock
- mountPath: /etc/localtime
name: localtime
volumes:
- name: docker-sock
hostPath:
path: /var/run/docker.sock
- name: localtime
hostPath:
path: /etc/localtime |
Run Agent as DaemonSet
Activate Sematext Agent Docker with kubectl:
> kubectl create -f sematext-agent-daemonset.yml daemonset "sematext-agent-daemonset" created |
Now let’s check if the agent got deployed to all nodes:
> kubectl get pods NAME READY STATUS RESTARTS AGE sematext-agent-nh4ez 0/1 ContainerCreating 0 6s sematext-agent-s47vz 0/1 ImageNotReady 0 6s |
The status “ImageNotReady” or “ContainerCreating” might be visible for a short time because Kubernetes must download the image for sematext/sematext-agent-docker first. The setting imagePullPolicy: "Always" specified in sematext-agent-daemonset.yml makes sure that Sematext Agent gets updated automatically using the image from Docker-Hub.
If we check again we’ll see Sematext Docker Agent got deployed to (all) cluster nodes:
> kubectl get pods -l sematext-agent NAME READY STATUS RESTARTS AGE sematext-agent-nh4ez 1/1 Running 0 8s sematext-agent-s47vz 1/1 Running 0 8s |
Less than a minute after the deployment you should see your Kubernetes metrics and logs! Below are screenshots of various out of the box reports and explanations of various metrics’ meanings.
Interpretation of Kubernetes Metrics
The metrics from all Kubernetes nodes are collected in a single SPM App, which aggregates metrics on several levels:
- Cluster - metrics aggregated over all nodes displayed in SPM overview
- Host / node level - metrics aggregated per node
- Docker Image level - metrics aggregated by image name, e.g. all nginx webserver containers
- Docker Container level - metrics aggregated for a single container
![]() |
| Host and Container Metrics from the Kubernetes Cluster |
Each detailed chart has filter options for Node, Docker Image, and Docker Container. As Kubernetes uses the pod name in the name of the Docker Containers a search by pod name in the Docker Container filter makes it easy to select all containers for a specific pod.
Let’s have a look at a few Kubernetes (and Docker) key metrics provided by SPM.
Host Metrics such as CPU, Memory and Disk space usage. Docker images and containers consume more disk space than regular processes installed on a host. For example, an application image might include a Linux operating system and might have a size of 150-700 MB depending on the size of the base image and installed tools in the container. Data containers consume disk space on the host as well. In our experience watching the disk space and using cleanup tools is essential for continuous operations of Docker hosts.
Container count - represents the number of running containers per host
![]() |
| Container Counters per Kubernetes Node over time |
Container Memory and Memory Fail Counters. These metrics are important to watch and very important to tune applications. Memory limits should fit the footprint of the deployed pod (application) to avoid situations where Kubernetes uses default limits (e.g. defined for a namespace), which could lead to OOM kills of containers. Memory fail counters reflect the number of failed memory allocations in a container, and in case of OOM kills a Docker Event is triggered. This event is then displayed in SPM because
Sematext Docker Agents collects all Docker Events. The best practice is to tune memory setting in a few iterations:
- Monitor memory usage of the application container
- Set memory limits according to the observations
- Continue monitoring of memory, memory fail counters, and Out-Of-Memory events. If OOM events happen, the container memory limits may need to be increased, or debugging is required to find the reason for the high memory consumptions.
![]() |
| Container memory usage, limits and fail counters |
Container CPU usage and throttled CPU time. The CPU usage can be limited by CPU shares - unlike memory, CPU usage it is not a hard limit. Containers might use more CPU as long the resource is available, but in situations where other containers need the CPU limits apply and the CPU gets throttled to the limit.
![]()
There are more
docker metrics to watch, like disk I/O throughput, network throughput and network errors for containers, but let’s continue by looking at Kubernetes Logs next.
Understand Kubernetes Logs
Kubernetes containers’ logs are not much different from Docker container logs. However, Kubernetes users need to view logs for the deployed pods. That’s why it is very useful to have Kubernetes-specific information available for log search, such as:
- Kubernetes name space
- Kubernetes pod name
- Kubernetes container name
- Docker image name
- Kubernetes UID
Sematext Docker Agent extracts this information from the Docker container names and tags all logs with the information mentioned above. Having these data extracted in individual fields makes it is very easy to watch logs of deployed pods, build reports from logs, quickly narrow down to problematic pods while troubleshooting, and so on! If Kubernetes core components (such as kubelet, proxy, api server) are deployed via Docker the Sematext Docker Agent will collect Kubernetes core components logs as well.
![]() |
| All logs from Kubernetes containers in Logsene |
There are many other useful features Logsene and Sematext Docker Agent give you out of the box, such as:
- Automatic format detection and parsing of logs
- Sematext Docker Agent includes patterns to recognize and parse many log formats
- Custom pattern definitions for specific images and application types
- Automatic Geo-IP enrichment for container logs
- Filtering logs e.g. to exclude noisy services
- Masking of sensitive data in specific log fields (phone numbers, payment information, authentication tokens)
- Alerts and scheduled reports based on logs
- Analytics for structured logs e.g. in Kibana or Grafana
--Stefan Thies, Developer Evangelist, at Sematext
↧
November 22, 2016, 7:20 am
Editor's note: Today’s post is by Sebastien Goasguen, Founder of Skippbox, showing a new tool to move from ‘docker-compose’ to Kubernetes.
At Skippbox, we developed kompose a tool to automatically transform your Docker Compose application into Kubernetes manifests. Allowing you to start a Compose application on a Kubernetes cluster with a single kompose up command. We’re extremely happy to have donated kompose to the Kubernetes Incubator. So here’s a quick introduction about it and some motivating factors that got us to develop it.Docker is terrific for developers. It allows everyone to get started quickly with an application that has been packaged in a Docker image and is available on a Docker registry. To build a multi-container application, Docker has developed Docker-compose (aka Compose). Compose takes in a yaml based manifest of your multi-container application and starts all the required containers with a single command docker-compose up. However Compose only works locally or with a Docker Swarm cluster.
But what if you wanted to use something else than Swarm? Like Kubernetes of course.The Compose format is not a standard for defining distributed applications. Hence you are left re-writing your application manifests in your container orchestrator of choice.
We see kompose as a terrific way to expose Kubernetes principles to Docker users as well as to easily migrate from Docker Swarm to Kubernetes to operate your applications in production.Over the summer, Kompose has found a new gear with help from Tomas Kral and Suraj Deshmukh from Red Hat, and Janet Kuo from Google. Together with our own lead kompose developer Nguyen An-Tu they are making kompose even more exciting. We proposed Kompose to the Kubernetes Incubator within the SIG-apps and we received approval from the general Kubernetes community; you can now find kompose in the Kubernetes Incubator.Kompose now supports Docker-compose v2 format, persistent volume claims have been added recently, as well as multiple container per pods. It can also be used to target Openshift deployments, by specifying a different provider than the default Kubernetes. Kompose is also now available in Fedora packages and we look forward to see it in CentOS distributions in the coming weeks.kompose is a single Golang binary that you build or install from the release on GitHub. Let’s skip the build instructions and dive straight into an example.Let's take it for a spin!Guestbook application with DockerThe Guestbook application has become the canonical example for Kubernetes. In Docker-compose format, the guestbook can be started with this minimal file:version: "2"
services: redis-master: image: gcr.io/google_containers/redis:e2e ports: - "6379" redis-slave: image: gcr.io/google_samples/gb-redisslave:v1 ports: - "6379" environment: - GET_HOSTS_FROM=dns frontend: image: gcr.io/google-samples/gb-frontend:v4 ports: - "80:80" environment: - GET_HOSTS_FROM=dns |
It consists of three services. A redis-master node, a set of redis-slave that can be scaled and find the redis-master via its DNS name. And a PHP frontend that exposes itself on port 80. The resulting application allows you to leave short messages which are stored in the redis cluster.To get it started with docker-compose on a vanilla Docker host do:$ docker-compose -f docker-guestbook.yml up -d Creating network "examples_default" with the default driver Creating examples_redis-slave_1 Creating examples_frontend_1 Creating examples_redis-master_1 |
So far so good, this is plain Docker usage. Now let’s see how to get this on Kubernetes without having to re-write anything.
Guestbook with 'kompose'
Kompose currently has three main commands up, down and convert. Here for simplicity we will show a single usage to bring up the Guestbook application.
Similarly to docker-compose, we can use the kompose up command pointing to the Docker-compose file representing the Guestbook application. Like so:
$ kompose -f ./examples/docker-guestbook.yml up We are going to create Kubernetes deployment and service for your dockerized application. If you need more kind of controllers, use 'kompose convert' and 'kubectl create -f' instead.
INFO[0000] Successfully created service: redis-master INFO[0000] Successfully created service: redis-slave INFO[0000] Successfully created service: frontend INFO[0000] Successfully created deployment: redis-master INFO[0000] Successfully created deployment: redis-slave INFO[0000] Successfully created deployment: frontend
Application has been deployed to Kubernetes. You can run 'kubectl get deployment,svc' for details. |
kompose automatically converted the Docker-compose file into Kubernetes objects. By default, it created one deployment and one service per compose services. In addition it automatically detected your current Kubernetes endpoint and created the resources onto it. A set of flags can be used to generate Replication Controllers, Replica Sets or Daemon Sets instead of Deployments.
And that's it! Nothing else to do, the conversion happened automatically.
Now, if you already now Kubernetes a bit, you’re familiar with the client kubectl and you can check what was created on your cluster.
$ kubectl get pods,svc,deployments NAME READY STATUS RESTARTS AGE frontend-3780173733-0ayyx 1/1 Running 0 1m redis-master-3028862641-8miqn 1/1 Running 0 1m redis-slave-3788432149-t3ejp 1/1 Running 0 1m NAME CLUSTER-IP EXTERNAL-IP PORT(S) AGE frontend 10.0.0.34 <none> 80/TCP 1m redis-master 10.0.0.219 <none> 6379/TCP 1m redis-slave 10.0.0.84 <none> 6379/TCP 1m NAME DESIRED CURRENT UP-TO-DATE
AVAILABLE AGE frontend 1 1 1 1 1m redis-master 1 1 1 1 1m redis-slave 1 1 1 1 1m |
Hopefully this gave you a quick tour of kompose and got you excited. They are more exciting features, like creating different type of resources, creating Helm charts and even using the experimental Docker bundle format as input. Check Lachlan Evenson’s blog on using a Docker bundle with Kubernetes. For an overall demo, see our talk from KubeCon
Head over to the Kubernetes Incubator and check out kompose, it will help you move easily from your Docker compose applications to Kubernetes clusters in production.
↧
December 8, 2016, 11:00 am
Editor's note: Today’s post is by Bernard Van De Walle, Kubernetes Lead Engineer, at Aporeto, showing how they took a new approach to the Kubernetes network policy enforcement.
Kubernetes Network Policies
Kubernetes supports a new API for network policies that provides a sophisticated model for isolating applications and reducing their attack surface. This feature, which came out of the SIG-Network group, makes it very easy and elegant to define network policies by using the built-in labels and selectors Kubernetes constructs.
Kubernetes has left it up to third parties to implement these network policies and does not provide a default implementation.
We want to introduce a new way to think about “Security” and “Network Policies”. We want to show that security and reachability are two different problems, and that security policies defined using endpoints (pods labels for example) do not specifically need to be implemented using network primitives.
Most of us at Aporeto come from a Network/SDN background, and we knew how to implement those policies by using traditional networking and firewalling: Translating the pods identity and policy definitions to network constraints, such as IP addresses, subnets, and so forth.
However, we also knew from past experiences that using an external control plane also introduces a whole new set of challenges: This distribution of ACLs requires very tight synchronization between Kubernetes workers; and every time a new pod is instantiated, ACLs need to be updated on all other pods that have some policy related to the new pod. Very tight synchronization is fundamentally a quadratic state problem and, while shared state mechanisms can work at a smaller scale, they often have convergence, security, and eventual consistency issues in large scale clusters.
From Network Policies to Security Policies
At Aporeto, we took a different approach to the network policy enforcement, by actually decoupling the network from the policy. We open sourced our solution as Trireme, which translates the network policy to an authorization policy, and it implements a transparent authentication and authorization function for any communication between pods. Instead of using IP addresses to identify pods, it defines a cryptographically signed identity for each pod as the set of its associated labels. Instead of using ACLs or packet filters to enforce policy, it uses an authorization function where a container can only receive traffic from containers with an identity that matches the policy requirements.
The authentication and authorization function in Trireme is overlaid on the TCP negotiation sequence. Identity (i.e. set of labels) is captured as a JSON Web Token (JWT), signed by local keys, and exchanged during the Syn/SynAck negotiation. The receiving worker validates that the JWTs are signed by a trusted authority (authentication step) and validates against a cached copy of the policy that the connection can be accepted. Once the connection is accepted, the rest of traffic flows through the Linux kernel and all of the protections that it can potentially offer (including conntrack capabilities if needed). The current implementation uses a simple user space process that captures the initial negotiation packets and attaches the authorization information as payload. The JWTs include nonces that are validated during the Ack packet and can defend against man-in-the-middle or replay attacks.
![]()
Kubernetes is unique in its ability to scale and provide an extensible security support for the deployment of containers and microservices. Trireme provides a simple, secure, and scalable mechanism for enforcing these policies. You can deploy and try Trireme on top of Kubernetes by using a provided Daemon Set. You'll need to modify some of the YAML parameters based on your cluster architecture. All the steps are described in detail in the deployment GitHub folder. The same folder contains an example 3-tier policy that you can use to test the traffic pattern.To learn more, download the code, and engage with the project, visit:- Trireme on GitHub
- Trireme for Kubernetes by Aporeto on GitHub
--Bernard Van De Walle, Kubernetes lead engineer, Aporeto
↧
↧
December 13, 2016, 9:00 am
Today we’re announcing the release of Kubernetes 1.5. This release follows close on the heels of KubeCon/CloundNativeCon, where users gathered to share how they’re running their applications on Kubernetes. Many of you expressed interest in running stateful applications in containers with the eventual goal of running all applications on Kubernetes. If you have been waiting to try running a distributed database on Kubernetes, or for ways to guarantee application disruption SLOs for stateful and stateless apps, this release has solutions for you.
StatefulSet and PodDisruptionBudget are moving to beta. Together these features provide an easier way to deploy and scale stateful applications, and make it possible to perform cluster operations like node upgrade without violating application disruption SLOs.
You will also find usability improvements throughout the release, starting with the kubectl command line interface you use so often. For those who have found it hard to set up a multi-cluster federation, a new command line tool called ‘kubefed’ is here to help. And a much requested multi-zone Highly Available (HA) master setup script has been added to kube-up.
Did you know the Kubernetes community is working to support Windows containers? If you have .NET developers, take a look at the work on Windows containers in this release. This work is in early stage alpha and we would love your feedback.
Lastly, for those interested in the internals of Kubernetes, 1.5 introduces Container Runtime Interface or CRI, which provides an internal API abstracting the container runtime from kubelet. This decoupling of the runtime gives users choice in selecting a runtime that best suits their needs. This release also introduces containerized node conformance tests that verify that the node software meets the minimum requirements to join a Kubernetes cluster.
What’s New
StatefulSet beta (formerly known as PetSet) allows workloads that require persistent identity or per-instance storage to be created, scaled, deleted and repaired on Kubernetes. You can use StatefulSets to ease the deployment of any stateful service, and tutorial examples are available in the repository. In order to ensure that there are never two pods with the same identity, the Kubernetes node controller no longer force deletes pods on unresponsive nodes. Instead, it waits until the old pod is confirmed dead in one of several ways: automatically when the kubelet reports back and confirms the old pod is terminated; automatically when a cluster-admin deletes the node; or when a database admin confirms it is safe to proceed by force deleting the old pod. Users are now warned if they try to force delete pods via the CLI. For users who will be migrating from PetSets to StatefulSets, please follow the upgrade guide.
PodDisruptionBudget beta is an API object that specifies the minimum number or minimum percentage of replicas of a collection of pods that must be up at any time. With PodDisruptionBudget, an application deployer can ensure that cluster operations that voluntarily evict pods will never take down so many simultaneously as to cause data loss, an outage, or an unacceptable service degradation. In Kubernetes 1.5 the “kubectl drain” command supports PodDisruptionBudget, allowing safe draining of nodes for maintenance activities, and it will soon also be used by node upgrade and cluster autoscaler (when removing nodes). This can be useful for a quorum based application to ensure the number of replicas running is never below the number needed for quorum, or for a web front end to ensure the number of replicas serving load never falls below a certain percentage.
Kubefed alpha is a new command line tool to help you manage federated clusters, making it easy to deploy new federation control planes and add or remove clusters from existing federations. Also new in cluster federation is the addition of ConfigMaps alpha and DaemonSets alpha and deployments alpha to the federation API allowing you to create, update and delete these objects across multiple clusters from a single endpoint.
HA Masters alpha provides the ability to create and delete clusters with highly available (replicated) masters on GCE using the kube-up/kube-down scripts. Allows setup of zone distributed HA masters, with at least one etcd replica per zone, at least one API server per zone, and master-elected components like scheduler and controller-manager distributed across zones.Windows server containers alpha provides initial support for Windows Server 2016 nodes and scheduling Windows Server Containers.
Container Runtime Interface (CRI) alpha introduces the v1 CRI API to allow pluggable container runtimes; an experimental docker-CRI integration is ready for testing and feedback.
Node conformance test beta is a containerized test framework that provides a system verification and functionality test for nodes. The test validates whether the node meets the minimum requirements for Kubernetes; a node that passes the tests is qualified to join a Kubernetes. Node conformance test is available at: gcr.io/google_containers/node-test:0.2 for users to verify node setup.
These are just some of the highlights in our last release for the year. For a complete list please visit the release notes.
AvailabilityKubernetes 1.5 is available for download here on GitHub and via get.k8s.io. To get started with Kubernetes, try one of the new interactive tutorials. Don’t forget to take 1.5 for a spin before the holidays!
User AdoptionIt’s been a year-and-a-half since GA, and the rate of Kubernetes user adoption continues to surpass estimates. Organizations running production workloads on Kubernetes include the world's largest companies, young startups, and everything in between. Since Kubernetes is open and runs anywhere, we’ve seen adoption on a diverse set of platforms; Pokémon Go (Google Cloud), Ticketmaster (AWS), SAP (OpenStack), Box (bare-metal), and hybrid environments that mix-and-match the above. Here are a few user highlights:- Yahoo! JAPAN -- built an automated tool chain making it easy to go from code push to deployment, all while running OpenStack on Kubernetes.
- Walmart -- will use Kubernetes with OneOps to manage its incredible distribution centers, helping its team with speed of delivery, systems uptime and asset utilization.
- Monzo -- a European startup building a mobile first bank, is using Kubernetes to power its core platform that can handle extreme performance and consistency requirements.
Kubernetes EcosystemThe Kubernetes ecosystem is growing rapidly, including Microsoft's support for Kubernetes in Azure Container Service, VMware's integration of Kubernetes in its Photon Platform, and Canonical’s commercial support for Kubernetes. This is in addition to the thirty plus Technology & Service Partners that already provide commercial services for Kubernetes users.
The CNCF recently announced the Kubernetes Managed Service Provider (KMSP) program, a pre-qualified tier of service providers with experience helping enterprises successfully adopt Kubernetes. Furthering the knowledge and awareness of Kubernetes, The Linux Foundation, in partnership with CNCF, will develop and operate the Kubernetes training and certification program -- the first course designed is Kubernetes Fundamentals.
Community VelocityIn the past three months we’ve seen more than a hundred new contributors join the project with some 5,000 commits pushed, reaching new milestones by bringing the total for the core project to 1,000+ contributors and 40,000+ commits. This incredible momentum is only possible by having an open design, being open to new ideas, and empowering an open community to be welcoming to new and senior contributors alike. A big thanks goes out to the release team for 1.5 -- Saad Ali of Google, Davanum Srinivas of Mirantis, and Caleb Miles of CoreOS for their work bringing the 1.5 release to light.
Offline, the community can be found at one of the many Kubernetes related meetups around the world. The strength and scale of the community was visible in the crowded halls of CloudNativeCon/KubeCon Seattle (the recorded user talks are here). The next CloudNativeCon + KubeCon is in Berlin March 29-30, 2017, be sure to get your ticket and submit your talk before the CFP deadline of Dec 16th.
Ready to start contributing? Share your voice at our weekly community meeting. Thank you for your contributions and support!-- Aparna Sinha, Senior Product Manager, Google
↧
December 19, 2016, 2:35 pm
With the help of our growing community of 1,000 contributors, we pushed some 5,000 commits to extend support for production workloads and deliver Kubernetes 1.5. While many improvements and new features have been added, we selected few to highlight in a series of in-depths posts listed below.
This progress is our commitment in continuing to make Kubernetes best way to manage your production workloads at scale.Day 1 | |
Day 2 | |
Day 3 | |
Day 4 | |
Day 5 | |
Connect
Get involved with the Kubernetes project on GitHub Connect with the community on Slack
↧
December 19, 2016, 2:36 pm
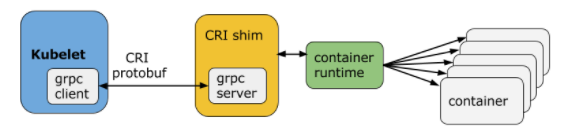
At the lowest layers of a Kubernetes node is the software that, among other things, starts and stops containers. We call this the “Container Runtime”. The most widely known container runtime is Docker, but it is not alone in this space. In fact, the container runtime space has been rapidly evolving. As part of the effort to make Kubernetes more extensible, we've been working on a new plugin API for container runtimes in Kubernetes, called "CRI".
What is the CRI and why does Kubernetes need it?
Each container runtime has it own strengths, and many users have asked for Kubernetes to support more runtimes. In the Kubernetes 1.5 release, we are proud to introduce the Container Runtime Interface (CRI) -- a plugin interface which enables kubelet to use a wide variety of container runtimes, without the need to recompile. CRI consists of a protocol buffers and gRPC API, and libraries, with additional specifications and tools under active development. CRI is being released as Alpha in Kubernetes 1.5.
Supporting interchangeable container runtimes is not a new concept in Kubernetes. In the 1.3 release, we announced the rktnetes project to enable rkt container engine as an alternative to the Docker container runtime. However, both Docker and rkt were integrated directly and deeply into the kubelet source code through an internal and volatile interface. Such an integration process requires a deep understanding of Kubelet internals and incurs significant maintenance overhead to the Kubernetes community. These factors form high barriers to entry for nascent container runtimes. By providing a clearly-defined abstraction layer, we eliminate the barriers and allow developers to focus on building their container runtimes. This is a small, yet important step towards truly enabling pluggable container runtimes and building a healthier ecosystem.
Overview of CRIKubelet communicates with the container runtime (or a CRI shim for the runtime) over Unix sockets using the gRPC framework, where kubelet acts as a client and the CRI shim as the server.
The protocol buffers API includes two gRPC services, ImageService, and RuntimeService. The ImageService provides RPCs to pull an image from a repository, inspect, and remove an image. The RuntimeService contains RPCs to manage the lifecycle of the pods and containers, as well as calls to interact with containers (exec/attach/port-forward). A monolithic container runtime that manages both images and containers (e.g., Docker and rkt) can provide both services simultaneously with a single socket. The sockets can be set in Kubelet by --container-runtime-endpoint and --image-service-endpoint flags.
Pod and container lifecycle managementservice RuntimeService { // Sandbox operations. rpc RunPodSandbox(RunPodSandboxRequest) returns (RunPodSandboxResponse) {}
rpc StopPodSandbox(StopPodSandboxRequest) returns (StopPodSandboxResponse) {}
rpc RemovePodSandbox(RemovePodSandboxRequest) returns (RemovePodSandboxResponse) {}
rpc PodSandboxStatus(PodSandboxStatusRequest) returns (PodSandboxStatusResponse) {}
rpc ListPodSandbox(ListPodSandboxRequest) returns (ListPodSandboxResponse) {}
// Container operations.
rpc CreateContainer(CreateContainerRequest) returns (CreateContainerResponse) {}
rpc StartContainer(StartContainerRequest) returns (StartContainerResponse) {}
rpc StopContainer(StopContainerRequest) returns (StopContainerResponse) {}
rpc RemoveContainer(RemoveContainerRequest) returns (RemoveContainerResponse) {}
rpc ListContainers(ListContainersRequest) returns (ListContainersResponse) {}
rpc ContainerStatus(ContainerStatusRequest) returns (ContainerStatusResponse) {} ...
} |
A Pod is composed of a group of application containers in an isolated environment with resource constraints. In CRI, this environment is called PodSandbox. We intentionally leave some room for the container runtimes to interpret the PodSandbox differently based on how they operate internally. For hypervisor-based runtimes, PodSandbox might represent a virtual machine. For others, such as Docker, it might be Linux namespaces. The PodSandbox must respect the pod resources specifications. In the v1alpha1 API, this is achieved by launching all the processes within the pod-level cgroup that kubelet creates and passes to the runtime.
Before starting a pod, kubelet calls RuntimeService.RunPodSandbox to create the environment. This includes setting up networking for a pod (e.g., allocating an IP). Once the PodSandbox is active, individual containers can be created/started/stopped/removed independently. To delete the pod, kubelet will stop and remove containers before stopping and removing the PodSandbox.
Kubelet is responsible for managing the lifecycles of the containers through the RPCs, exercising the container lifecycles hooks and liveness/readiness checks, while adhering to the restart policy of the pod.
Why an imperative container-centric interface?
Kubernetes has a declarative API with a Pod resource. One possible design we considered was for CRI to reuse the declarative Pod object in its abstraction, giving the container runtime freedom to implement and exercise its own control logic to achieve the desired state. This would have greatly simplified the API and allowed CRI to work with a wider spectrum of runtimes. We discussed this approach early in the design phase and decided against it for several reasons. First, there are many Pod-level features and specific mechanisms (e.g., the crash-loop backoff logic) in kubelet that would be a significant burden for all runtimes to reimplement. Second, and more importantly, the Pod specification was (and is) still evolving rapidly. Many of the new features (e.g., init containers) would not require any changes to the underlying container runtimes, as long as the kubelet manages containers directly. CRI adopts an imperative container-level interface so that runtimes can share these common features for better development velocity. This doesn't mean we're deviating from the "level triggered" philosophy - kubelet is responsible for ensuring that the actual state is driven towards the declared state.
Exec/attach/port-forward requestsservice RuntimeService { ... // ExecSync runs a command in a container synchronously.
rpc ExecSync(ExecSyncRequest) returns (ExecSyncResponse) {}
// Exec prepares a streaming endpoint to execute a command in the container.
rpc Exec(ExecRequest) returns (ExecResponse) {}
// Attach prepares a streaming endpoint to attach to a running container.
rpc Attach(AttachRequest) returns (AttachResponse) {}
// PortForward prepares a streaming endpoint to forward ports from a PodSandbox.
rpc PortForward(PortForwardRequest) returns (PortForwardResponse) {} ...
} |
Kubernetes provides features (e.g. kubectl exec/attach/port-forward) for users to interact with a pod and the containers in it. Kubelet today supports these features either by invoking the container runtime’s native method calls or by using the tools available on the node (e.g., nsenter and socat). Using tools on the node is not a portable solution because most tools assume the pod is isolated using Linux namespaces. In CRI, we explicitly define these calls in the API to allow runtime-specific implementations.
Another potential issue with the kubelet implementation today is that kubelet handles the connection of all streaming requests, so it can become a bottleneck for the network traffic on the node. When designing CRI, we incorporated this feedback to allow runtimes to eliminate the middleman. The container runtime can start a separate streaming server upon request (and can potentially account the resource usage to the pod!), and return the location of the server to kubelet. Kubelet then returns this information to the Kubernetes API server, which opens a streaming connection directly to the runtime-provided server and connects it to the client.
There are many other aspects of CRI that are not covered in this blog post. Please see the list of design docs and proposals for all the details.
Current status
Although CRI is still in its early stages, there are already several projects under development to integrate container runtimes using CRI. Below are a few examples:
If you are interested in trying these alternative runtimes, you can follow the individual repositories for the latest progress and instructions.
For developers interested in integrating a new container runtime, please see the developer guide for the known limitations and issues of the API. We are actively incorporating feedback from early developers to improve the API. Developers should expect occasional API breaking changes (it is Alpha, after all).
Try the new CRI-Docker integration
Kubelet does not yet use CRI by default, but we are actively working on making this happen. The first step is to re-integrate Docker with kubelet using CRI. In the 1.5 release, we extended kubelet to support CRI, and also added a built-in CRI shim for Docker. This allows kubelet to start the gRPC server on Docker’s behalf. To try out the new kubelet-CRI-Docker integration, you simply have to start the Kubernetes API server with --feature-gates=StreamingProxyRedirects=true to enable the new streaming redirect feature, and then start the kubelet with --experimental-cri=true.
Besides a few missing features, the new integration has consistently passed the main end-to-end tests. We plan to expand the test coverage soon and would like to encourage the community to report any issues to help with the transition.
CRI with Minikube
If you want to try out the new integration, but don’t have the time to spin up a new test cluster in the cloud yet, minikube is a great tool to quickly spin up a local cluster. Before you start, follow the instructions to download and install minikube.
1. Check the available Kubernetes versions and pick the latest 1.5.x version available. We will use v1.5.0-beta.1 as an example.
$ minikube get-k8s-versions |
2. Start a minikube cluster with the built-in docker CRI integration.
$ minikube start --kubernetes-version=v1.5.0-beta.1 --extra-config=kubelet.EnableCRI=true --network-plugin=kubenet --extra-config=kubelet.PodCIDR=10.180.1.0/24 --iso-url=http://storage.googleapis.com/minikube/iso/buildroot/minikube-v0.0.6.iso |
--extra-config=kubelet.EnableCRI=true` turns on the CRI implementation in kubelet. --network-plugin=kubenet and --extra-config=kubelet.PodCIDR=10.180.1.0/24 sets the network plugin to kubenet and ensures a PodCIDR is assigned to the node. Alternatively, you can use the cni plugin which does not rely on the PodCIDR. --iso-url sets an iso image for minikube to launch the node with. The image used in the example
3. Check the minikube log to check that CRI is enabled.
$ minikube logs | grep EnableCRI I1209 01:48:51.150789 3226 localkube.go:116] Setting EnableCRI to true on kubelet. |
4. Create a pod and check its status. You should see a “SandboxReceived” event as a proof that Kubelet is using CRI!
$ kubectl run foo --image=gcr.io/google_containers/pause-amd64:3.0 deployment "foo" created $ kubectl describe pod foo ... ... From Type Reason Message
... ----------------- ----- --------------- ----------------------------- ...{default-scheduler } Normal Scheduled Successfully assigned foo-141968229-v1op9 to minikube
...{kubelet minikube} Normal SandboxReceived Pod sandbox received, it will be created. ... |
Community
CRI is being actively developed and maintained by the Kubernetes SIG-Node community. We’d love to hear feedback from you. To join the community:
Post issues or feature requests on GitHub Join the #sig-node channel on Slack
--Yu-Ju Hong, Software Engineer, Google
↧
December 20, 2016, 1:41 pm
Editor’s note: this post is part of a series of in-depth articles on what's new in Kubernetes 1.5
In the latest release, Kubernetes 1.5, we’ve moved the feature formerly known as PetSet into beta as StatefulSet. There were no major changes to the API Object, other than the community selected name, but we added the semantics of “at most one pod per index” for deployment of the Pods in the set. Along with ordered deployment, ordered termination, unique network names, and persistent stable storage, we think we have the right primitives to support many containerized stateful workloads. We don’t claim that the feature is 100% complete (it is software after all), but we believe that it is useful in its current form, and that we can extend the API in a backwards-compatible way as we progress toward an eventual GA release.
When is StatefulSet the Right Choice for my Storage Application?
Deployments and ReplicaSets are a great way to run stateless replicas of an application on Kubernetes, but their semantics aren’t really right for deploying stateful applications. The purpose of StatefulSet is to provide a controller with the correct semantics for deploying a wide range of stateful workloads. However, moving your storage application onto Kubernetes isn’t always the correct choice. Before you go all in on converging your storage tier and your orchestration framework, you should ask yourself a few questions.
Can your application run using remote storage or does it require local storage media?
Currently, we recommend using StatefulSets with remote storage. Therefore, you must be ready to tolerate the performance implications of network attached storage. Even with storage optimized instances, you won’t likely realize the same performance as locally attached, solid state storage media. Does the performance of network attached storage, on your cloud, allow your storage application to meet its SLAs? If so, running your application in a StatefulSet provides compelling benefits from the perspective of automation. If the node on which your storage application is running fails, the Pod containing the application can be rescheduled onto another node, and, as it’s using network attached storage media, its data are still available after it’s rescheduled.
Do you need to scale your storage application?
What is the benefit you hope to gain by running your application in a StatefulSet? Do you have a single instance of your storage application for your entire organization? Is scaling your storage application a problem that you actually have? If you have a few instances of your storage application, and they are successfully meeting the demands of your organization, and those demands are not rapidly increasing, you’re already at a local optimum.
If, however, you have an ecosystem of microservices, or if you frequently stamp out new service footprints that include storage applications, then you might benefit from automation and consolidation. If you’re already using Kubernetes to manage the stateless tiers of your ecosystem, you should consider using the same infrastructure to manage your storage applications.
How important is predictable performance?
Kubernetes doesn’t yet support isolation for network or storage I/O across containers. Colocating your storage application with a noisy neighbor can reduce the QPS that your application can handle. You can mitigate this by scheduling the Pod containing your storage application as the only tenant on a node (thus providing it a dedicated machine) or by using Pod anti-affinity rules to segregate Pods that contend for network or disk, but this means that you have to actively identify and mitigate hot spots.
If squeezing the absolute maximum QPS out of your storage application isn’t your primary concern, if you’re willing and able to mitigate hotspots to ensure your storage applications meet their SLAs, and if the ease of turning up new "footprints" (services or collections of services), scaling them, and flexibly re-allocating resources is your primary concern, Kubernetes and StatefulSet might be the right solution to address it.
Does your application require specialized hardware or instance types?
If you run your storage application on high-end hardware or extra-large instance sizes, and your other workloads on commodity hardware or smaller, less expensive images, you may not want to deploy a heterogenous cluster. If you can standardize on a single instance size for all types of apps, then you may benefit from the flexible resource reallocation and consolidation, that you get from Kubernetes.
A Practical Example - ZooKeeper
ZooKeeper is an interesting use case for StatefulSet for two reasons. First, it demonstrates that StatefulSet can be used to run a distributed, strongly consistent storage application on Kubernetes. Second, it's a prerequisite for running workloads like Apache Hadoop and Apache Kakfa on Kubernetes. An in-depth tutorial on deploying a ZooKeeper ensemble on Kubernetes is available in the Kubernetes documentation, and we’ll outline a few of the key features below.
Creating a ZooKeeper EnsembleCreating an ensemble is as simple as using kubectl create to generate the objects stored in the manifest.service "zk-headless" created configmap "zk-config" created poddisruptionbudget "zk-budget" created statefulset "zk" created |
When you create the manifest, the StatefulSet controller creates each Pod, with respect to its ordinal, and waits for each to be Running and Ready prior to creating its successor.
$ kubectl get -w -l app=zk NAME READY STATUS RESTARTS AGE zk-0 0/1 Pending 0 0s zk-0 0/1 Pending 0 0s zk-0 0/1 Pending 0 7s zk-0 0/1 ContainerCreating 0 7s zk-0 0/1 Running 0 38s zk-0 1/1 Running 0 58s zk-1 0/1 Pending 0 1s zk-1 0/1 Pending 0 1s zk-1 0/1 ContainerCreating 0 1s zk-1 0/1 Running 0 33s zk-1 1/1 Running 0 51s zk-2 0/1 Pending 0 0s zk-2 0/1 Pending 0 0s zk-2 0/1 ContainerCreating 0 0s zk-2 0/1 Running 0 25s zk-2 1/1 Running 0 40s |
Examining the hostnames of each Pod in the StatefulSet, you can see that the Pods’ hostnames also contain the Pods’ ordinals.
$ for i in 0 1 2; do kubectl exec zk-$i -- hostname; done zk-0 zk-1 zk-2 |
ZooKeeper stores the unique identifier of each server in a file called “myid”. The identifiers used for ZooKeeper servers are just natural numbers. For the servers in the ensemble, the “myid” files are populated by adding one to the ordinal extracted from the Pods’ hostnames.$ for i in 0 1 2; do echo "myid zk-$i";kubectl exec zk-$i -- cat /var/lib/zookeeper/data/myid; done myid zk-0 1 myid zk-1 2 myid zk-2 3 |
Each Pod has a unique network address based on its hostname and the network domain controlled by the zk-headless Headless Service.
$ for i in 0 1 2; do kubectl exec zk-$i -- hostname -f; done zk-0.zk-headless.default.svc.cluster.local zk-1.zk-headless.default.svc.cluster.local zk-2.zk-headless.default.svc.cluster.local |
$ kubectl exec zk-0 -- cat /opt/zookeeper/conf/zoo.cfg clientPort=2181 dataDir=/var/lib/zookeeper/data dataLogDir=/var/lib/zookeeper/log tickTime=2000 initLimit=10 syncLimit=2000 maxClientCnxns=60 minSessionTimeout= 4000 maxSessionTimeout= 40000 autopurge.snapRetainCount=3 autopurge.purgeInteval=1 server.1=zk-0.zk-headless.default.svc.cluster.local:2888:3888 server.2=zk-1.zk-headless.default.svc.cluster.local:2888:3888 server.3=zk-2.zk-headless.default.svc.cluster.local:2888:3888 |
StatefulSet lets you deploy ZooKeeper in a consistent and reproducible way. You won’t create more than one server with the same id, the servers can find each other via a stable network addresses, and they can perform leader election and replicate writes because the ensemble has consistent membership.
The simplest way to verify that the ensemble works is to write a value to one server and to read it from another. You can use the “zkCli.sh” script that ships with the ZooKeeper distribution, to create a ZNode containing some data.
$ kubectl exec zk-0 zkCli.sh create /hello world ...
WATCHER::
WatchedEvent state:SyncConnected type:None path:null Created /hello |
You can use the same script to read the data from another server in the ensemble.
$ kubectl exec zk-1 zkCli.sh get /hello ...
WATCHER::
WatchedEvent state:SyncConnected type:None path:null world ... |
You can take the ensemble down by deleting the zk StatefulSet.
$ kubectl delete statefulset zk statefulset "zk" deleted |
The cascading delete destroys each Pod in the StatefulSet, with respect to the reverse order of the Pods’ ordinals, and it waits for each to terminate completely before terminating its predecessor.
$ kubectl get pods -w -l app=zk NAME READY STATUS RESTARTS AGE zk-0 1/1 Running 0 14m zk-1 1/1 Running 0 13m zk-2 1/1 Running 0 12m NAME READY STATUS RESTARTS AGE zk-2 1/1 Terminating 0 12m zk-1 1/1 Terminating 0 13m zk-0 1/1 Terminating 0 14m zk-2 0/1 Terminating 0 13m zk-2 0/1 Terminating 0 13m zk-2 0/1 Terminating 0 13m zk-1 0/1 Terminating 0 14m zk-1 0/1 Terminating 0 14m zk-1 0/1 Terminating 0 14m zk-0 0/1 Terminating 0 15m zk-0 0/1 Terminating 0 15m zk-0 0/1 Terminating 0 15m |
You can use kubectl apply to recreate the zk StatefulSet and redeploy the ensemble.
service "zk-headless" configured configmap "zk-config" configured statefulset "zk" created |
If you use the “zkCli.sh” script to get the value entered prior to deleting the StatefulSet, you will find that the ensemble still serves the data.
$ kubectl exec zk-2 zkCli.sh get /hello ...
WATCHER::
WatchedEvent state:SyncConnected type:None path:null world ... |
StatefulSet ensures that, even if all Pods in the StatefulSet are destroyed, when they are rescheduled, the ZooKeeper ensemble can elect a new leader and continue to serve requests.
Tolerating Node Failures
ZooKeeper replicates its state machine to different servers in the ensemble for the explicit purpose of tolerating node failure. By default, the Kubernetes Scheduler could deploy more than one Pod in the zk StatefulSet to the same node. If the zk-0 and zk-1 Pods were deployed on the same node, and that node failed, the ZooKeeper ensemble couldn’t form a quorum to commit writes, and the ZooKeeper service would experience an outage until one of the Pods could be rescheduled.
You should always provision headroom capacity for critical processes in your cluster, and if you do, in this instance, the Kubernetes Scheduler will reschedule the Pods on another node and the outage will be brief.
If the SLAs for your service preclude even brief outages due to a single node failure, you should use a PodAntiAffinity annotation. The manifest used to create the ensemble contains such an annotation, and it tells the Kubernetes Scheduler to not place more than one Pod from the zk StatefulSet on the same node.
Tolerating Planned Maintenance
The manifest used to create the ZooKeeper ensemble also creates a PodDistruptionBudget, zk-budget. The zk-budget informs Kubernetes about the upper limit of disruptions (unhealthy Pods) that the service can tolerate.
{ "podAntiAffinity": { "requiredDuringSchedulingRequiredDuringExecution": [{ "labelSelector": { "matchExpressions": [{ "key": "app", "operator": "In", "values": ["zk-headless"] }] }, "topologyKey": "kubernetes.io/hostname" }] } } } |
$ kubectl get poddisruptionbudget zk-budget NAME MIN-AVAILABLE ALLOWED-DISRUPTIONS AGE zk-budget 2 1 2h |
zk-budget indicates that at least two members of the ensemble must be available at all times for the ensemble to be healthy. If you attempt to drain a node prior taking it offline, and if draining it would terminate a Pod that violates the budget, the drain operation will fail. If you use kubectl drain, in conjunction with PodDisruptionBudgets, to cordon your nodes and to evict all Pods prior to maintenance or decommissioning, you can ensure that the procedure won’t be disruptive to your stateful applications.
Looking Forward
As the Kubernetes development looks towards GA, we are looking at a long list of suggestions from users. If you want to dive into our backlog, checkout the
GitHub issues with the stateful label. However, as the resulting API would be hard to comprehend, we don't expect to implement all of these feature requests. Some feature requests, like support for rolling updates, better integration with node upgrades, and using fast local storage, would benefit most types of stateful applications, and we expect to prioritize these. The intention of StatefulSet is to be able to run a large number of applications well, and not to be able to run all applications perfectly. With this in mind, we avoided implementing StatefulSets in a way that relied on hidden mechanisms or inaccessible features. Anyone can write a controller that works similarly to StatefulSets. We call this "making it forkable."
Over the next year, we expect many popular storage applications to each have their own community-supported, dedicated controllers or "
operators". We've already heard of work on custom controllers for etcd, Redis, and ZooKeeper. We expect to write some more ourselves and to support the community in developing others.
The Operators for
etcd and
Prometheus from CoreOS, demonstrate an approach to running stateful applications on Kubernetes that provides a level of automation and integration beyond that which is possible with StatefulSet alone. On the other hand, using a generic controller like StatefulSet or Deployment means that a wide range of applications can be managed by understanding a single config object. We think Kubernetes users will appreciate having the choice of these two approaches.
--Kenneth Owens & Eric Tune, Software Engineers, Google
↧
↧
December 21, 2016, 3:30 pm
Editor’s note: this post is part of a series of in-depth articles on what's new in Kubernetes 1.5
Extending on the theme of giving users choice, Kubernetes 1.5 release includes the support for Windows Servers. WIth more than 80% of enterprise apps running Java on Linux or .Net on Windows, Kubernetes is previewing capabilities that extends its reach to the mass majority of enterprise workloads.
The new Kubernetes Windows Server 2016 and Windows Container support includes public preview with the following features:- Containerized Multiplatform Applications - Applications developed in operating system neutral languages like Go and .NET Core were previously impossible to orchestrate between Linux and Windows. Now, with support for Windows Server 2016 in Kubernetes, such applications can be deployed on both Windows Server as well as Linux, giving the developer choice of the operating system runtime. This capability has been desired by customers for almost two decades.
- Support for Both Windows Server Containers and Hyper-V Containers - There are two types of containers in Windows Server 2016. Windows Containers is similar to Docker containers on Linux, and uses kernel sharing. The other, called Hyper-V Containers, is more lightweight than a virtual machine while at the same time offering greater isolation, its own copy of the kernel, and direct memory assignment. Kubernetes can orchestrate both these types of containers.
- Expanded Ecosystem of Applications - One of the key drivers of introducing Windows Server support in Kubernetes is to expand the ecosystem of applications supported by Kubernetes: IIS, .NET, Windows Services, ASP.NET, .NET Core, are some of the application types that can now be orchestrated by Kubernetes, running inside a container on Windows Server.
- Coverage for Heterogeneous Data Centers - Organizations already use Kubernetes to host tens of thousands of application instances across Global 2000 and Fortune 500. This will allow them to expand Kubernetes to the large footprint of Windows Server.
The process to bring Windows Server to Kubernetes has been a truly multi-vendor effort and championed by the Windows Special Interest Group (SIG) - Apprenda, Google, Red Hat and Microsoft were all involved in bringing Kubernetes to Windows Server. On the community effort to bring Kubernetes to Windows Server, Taylor Brown, Principal Program Manager at Microsoft stated that “This new Kubernetes community work furthers Windows Server container support options for popular orchestrators, reinforcing Microsoft’s commitment to choice and flexibility for both Windows and Linux ecosystems.”
Guidance for Current UsageWhere to use Windows Server support? | Right now organizations should start testing Kubernetes on Windows Server and provide feedback. Most organizations take months to set up hardened production environments and general availability should be available in next few releases of Kubernetes. |
What works? | Most of the Kubernetes constructs, such as Pods, Services, Labels, etc. work with Windows Containers. |
What doesn’t work yet? | Pod abstraction is not same due to networking namespaces. Net result is that Windows containers in a single POD cannot communicate over localhost. Linux containers can share networking stack by placing them in the same network namespace. DNS capabilities are not fully implemented UDP is not supported inside a container
|
When will it be ready for all production workloads (general availability)? | The goal is to refine the networking and other areas that need work to get Kubernetes users a production version of Windows Server 2016 - including with Windows Nano Server and Windows Server Core installation options - support in the next couple releases. |
Technical Demo
Roadmap
Support for Windows Server-based containers is in alpha release mode for Kubernetes 1.5, but the community is not stopping there. Customers want enterprise hardened container scheduling and management for their entire tech portfolio. That has to include full parity of features among Linux and Windows Server in production. The Windows Server SIG will deliver that parity within the next one or two releases of Kubernetes through a few key areas of investment:- Networking - the SIG will continue working side by side with Microsoft to enhance the networking backbone of Windows Server Containers, specifically around lighting up container mode networking and native network overlay support for container endpoints.
- OOBE - Improving the setup, deployment, and diagnostics for a Windows Server node, including the ability to deploy to any cloud (Azure, AWS, GCP)
- Runtime Operations - the SIG will play a key part in defining the monitoring interface of the Container Runtime Interface (CRI), leveraging it to provide deep insight and monitoring for Windows Server-based containers
Get Started
To get started with Kubernetes on Windows Server 2016, please visit the GitHub guide for more details.If you want to help with Windows Server support, then please connect with the Windows Server SIG or connect directly with Michael Michael, the SIG lead, on GitHub.
--Michael Michael, Senior Director of Product Management, Apprenda
![]() |
| Kubernetes on Windows Server 2016 Architecture |
↧
December 22, 2016, 3:00 pm
Editor’s note: this post is part of a series of in-depth articles on what's new in Kubernetes 1.5
In the latest Kubernetes 1.5 release, you’ll notice that support for Cluster Federation is maturing. That functionality was introduced in Kubernetes 1.3, and the 1.5 release includes a number of new features, including an easier setup experience and a step closer to supporting all Kubernetes API objects.
A new command line tool called ‘kubefed’ was introduced to make getting started with Cluster Federation much simpler. Also, alpha level support was added for Federated DaemonSets, Deployments and ConfigMaps. In summary:- DaemonSets are Kubernetes deployment rules that guarantee that a given pod is always present at every node, as new nodes are added to the cluster (more info).
- Deployments describe the desired state of Replica Sets (more info).
- ConfigMaps are variables applied to Replica Sets (which greatly improves image reusability as their parameters can be externalized - more info).
Federated DaemonSets, Federated Deployments, Federated ConfigMaps take the qualities of the base concepts to the next level. For instance, Federated DaemonSets guarantee that a pod is deployed on every node of the newly added cluster.
But what actually is “federation”? Let’s explain it by what needs it satisfies. Imagine a service that operates globally. Naturally, all its users expect to get the same quality of service, whether they are located in Asia, Europe, or the US. What this means is that the service must respond equally fast to requests at each location. This sounds simple, but there’s lots of logic involved behind the scenes. This is what Kubernetes Cluster Federation aims to do.
How does it work? One of the Kubernetes clusters must become a master by running a Federation Control Plane. In practice, this is a controller that monitors the health of other clusters, and provides a single entry point for administration. The entry point behaves like a typical Kubernetes cluster. It allows creating Replica Sets, Deployments, Services, but the federated control plane passes the resources to underlying clusters. This means that if we request the federation control plane to create a Replica Set with 1,000 replicas, it will spread the request across all underlying clusters. If we have 5 clusters, then by default each will get its share of 200 replicas.
This on its own is a powerful mechanism. But there’s more. It’s also possible to create a Federated Ingress. Effectively, this is a global application-layer load balancer. Thanks to an understanding of the application layer, it allows load balancing to be “smarter” -- for instance, by taking into account the geographical location of clients and servers, and routing the traffic between them in an optimal way.
In summary, with Kubernetes Cluster Federation, we can facilitate administration of all the clusters (single access point), but also optimize global content delivery around the globe. In the following sections, we will show how it works.
Creating a Federation Plane
In this exercise, we will federate a few clusters. For convenience, all commands have been grouped into 6 scripts available here:- 0-settings.sh
- 1-create.sh
- 2-getcredentials.sh
- 3-initfed.sh
- 4-joinfed.sh
- 5-destroy.sh
First we need to define several variables (0-settings.sh)$ cat 0-settings.sh && . 0-settings.sh # this project create 3 clusters in 3 zones. FED_HOST_CLUSTER points to the one, which will be used to deploy federation control plane export FED_HOST_CLUSTER=us-east1-b
# Google Cloud project name export FED_PROJECT=<YOUR PROJECT e.g. company-project>
# DNS suffix for this federation. Federated Service DNS names are published with this suffix. This must be a real domain name that you control and is programmable by one of the DNS providers (Google Cloud DNS or AWS Route53) export FED_DNS_ZONE=<YOUR DNS SUFFIX e.g. example.com> |
And get kubectl and kubefed binaries. (for installation instructions refer to guides here and here).Now the setup is ready to create a few Google Container Engine (GKE) clusters with gcloud container clusters create (1-create.sh). In this case one is in US, one in Europe and one in Asia.$ cat 1-create.sh && . 1-create.sh gcloud container clusters create gce-us-east1-b --project=${FED_PROJECT} --zone=us-east1-b --scopes cloud-platform,storage-ro,logging-write,monitoring-write,service-control,service-management,https://www.googleapis.com/auth/ndev.clouddns.readwrite
gcloud container clusters create gce-europe-west1-b --project=${FED_PROJECT} --zone=europe-west1-b --scopes cloud-platform,storage-ro,logging-write,monitoring-write,service-control,service-management,https://www.googleapis.com/auth/ndev.clouddns.readwrite
gcloud container clusters create gce-asia-east1-a --project=${FED_PROJECT} --zone=asia-east1-a --scopes cloud-platform,storage-ro,logging-write,monitoring-write,service-control,service-management,https://www.googleapis.com/auth/ndev.clouddns.readwrite |
The next step is fetching kubectl configuration with gcloud -q container clusters get-credentials (2-getcredentials.sh). The configurations will be used to indicate the current context for kubectl commands.$ cat 2-getcredentials.sh && . 2-getcredentials.sh gcloud -q container clusters get-credentials gce-us-east1-b --zone=us-east1-b --project=${FED_PROJECT}
gcloud -q container clusters get-credentials gce-europe-west1-b --zone=europe-west1-b --project=${FED_PROJECT}
gcloud -q container clusters get-credentials gce-asia-east1-a --zone=asia-east1-a --project=${FED_PROJECT} |
Let’s verify the setup:$ kubectl config get-contexts CURRENT NAME CLUSTER AUTHINFO NAMESPACE * gke_container-solutions_europe-west1-b_gce-europe-west1-b gke_container-solutions_europe-west1-b_gce-europe-west1-b gke_container-solutions_europe-west1-b_gce-europe-west1-b gke_container-solutions_us-east1-b_gce-us-east1-b gke_container-solutions_us-east1-b_gce-us-east1-b gke_container-solutions_us-east1-b_gce-us-east1-b gke_container-solutions_asia-east1-a_gce-asia-east1-a gke_container-solutions_asia-east1-a_gce-asia-east1-a gke_container-solutions_asia-east1-a_gce-asia-east1-a |
We have 3 clusters. One, indicated by the FED_HOST_CLUSTER environment variable, will be used to run the federation plane. For this, we will use the kubefed init federation command (3-initfed.sh).$ cat 3-initfed.sh && . 3-initfed.sh kubefed init federation --host-cluster-context=gke_${FED_PROJECT}_${FED_HOST_CLUSTER}_gce-${FED_HOST_CLUSTER} --dns-zone-name=${FED_DNS_ZONE} |
You will notice that after executing the above command, a new kubectl context has appeared:$ kubectl config get-contexts CURRENT NAME CLUSTER AUTHINFO NAMESPACE ... federation federation |
The federation context will become our administration entry point. Now it’s time to join clusters (4-joinfed.sh):
$ cat 4-joinfed.sh && . 4-joinfed.sh kubefed --context=federation join cluster-europe-west1-b --cluster-context=gke_${FED_PROJECT}_europe-west1-b_gce-europe-west1-b --host-cluster-context=gke_${FED_PROJECT}_${FED_HOST_CLUSTER}_gce-${FED_HOST_CLUSTER}
kubefed --context=federation join cluster-asia-east1-a --cluster-context=gke_${FED_PROJECT}_asia-east1-a_gce-asia-east1-a --host-cluster-context=gke_${FED_PROJECT}_${FED_HOST_CLUSTER}_gce-${FED_HOST_CLUSTER}
kubefed --context=federation join cluster-us-east1-b --cluster-context=gke_${FED_PROJECT}_us-east1-b_gce-us-east1-b --host-cluster-context=gke_${FED_PROJECT}_${FED_HOST_CLUSTER}_gce-${FED_HOST_CLUSTER} |
Note that cluster gce-us-east1-b is used here to run the federation control plane and also to work as a worker cluster. This circular dependency helps to use resources more efficiently and it can be verified by using the kubectl --context=federation get clusters command:$ kubectl --context=federation get clusters NAME STATUS AGE cluster-asia-east1-a Ready 7s cluster-europe-west1-b Ready 10s cluster-us-east1-b Ready 10s |
Using Federation To Run An Application
In our repository you will find instructions on how to build a docker image with a web service that displays the container’s hostname and the Google Cloud Platform (GCP) zone. An example output might look like this:
{"hostname":"k8shserver-6we2u","zone":"europe-west1-b"} |
$ kubectl --context=federation create -f rs/k8shserver |
And a Federated Service (k8shserver.yaml):$ kubectl --context=federation create -f service/k8shserver |
As you can see, the two commands refer to the “federation” context, i.e. to the federation control plane. After a few minutes, you will realize that underlying clusters run the Replica Set and the Service.
Creating The Ingress
After the Service is ready, we can create Ingress - the global load balancer. The command is like this: kubectl --context=federation create -f ingress/k8shserver.yaml |
The contents of the file point to the service we created in the previous step:
apiVersion: extensions/v1beta1 kind: Ingress metadata: name: k8shserver spec: backend: serviceName: k8shserver servicePort: 80 |
After a few minutes, we should get a global IP address:
$ kubectl --context=federation get ingress NAME HOSTS ADDRESS PORTS AGE k8shserver * 130.211.40.125 80 20m |
Effectively, the response of:
depends on the location of client. Something like this would be expected in the US:
{"hostname":"k8shserver-w56n4","zone":"us-east1-b"} |
Whereas in Europe, we might have:
{"hostname":"k8shserver-z31p1","zone":"eu-west1-b"} |
Please refer to this issue for additional details on how everything we've described works.
Demo
Summary
Cluster Federation is actively being worked on and is still not fully General Available. Some APIs are in beta and others are in alpha. Some features are missing, for instance cross-cloud load balancing is not supported (federated ingress currently only works on Google Cloud Platform as it depends on GCP
HTTP(S) Load Balancing).
Nevertheless, as the functionality matures, it will become an enabler for all companies that aim at global markets, but currently cannot afford sophisticated administration techniques as used by the likes of Netflix or Amazon. That’s why we closely watch the technology, hoping that it soon fulfills its promise.
PS. When done, remember to destroy your clusters:
--Lukasz Guminski, Software Engineer at Container Solutions. Allan Naim, Product Manager, Google
↧
December 23, 2016, 12:00 pm
Editor’s note: this post is part of a series of in-depth articles on what's new in Kubernetes 1.5
OpenAPI allows API providers to define their operations and models, and enables developers to automate their tools and generate their favorite language’s client to talk to that API server. Kubernetes has supported swagger 1.2 (older version of OpenAPI spec) for a while, but the spec was incomplete and invalid, making it hard to generate tools/clients based on it.
In Kubernetes 1.4, we introduced alpha support for the OpenAPI spec (formerly known as swagger 2.0 before it was donated to the Open API Initiative) by upgrading the current models and operations. Beginning in Kubernetes 1.5, the support for the OpenAPI spec has been completed by auto-generating the spec directly from Kubernetes source, which will keep the spec--and documentation--completely in sync with future changes in operations/models.
The new spec enables us to have better API documentation and we have even introduced a supported python client.
The spec is modular, divided by GroupVersion: this is future-proof, since we intend to allow separate GroupVersions to be served out of separate API servers.
The structure of spec is explained in detail in OpenAPI spec definition. We used operation’s tags to separate each GroupVersion and filled as much information as we can about paths/operations and models. For a specific operation, all parameters, method of call, and responses are documented.
For example, OpenAPI spec for reading a pod information is:
{ ...
"paths": { "/api/v1/namespaces/{namespace}/pods/{name}": {
"get": {
"description": "read the specified Pod",
"consumes": [
"*/*"
],
"produces": [
"application/json",
"application/yaml",
"application/vnd.kubernetes.protobuf"
],
"schemes": [
"https"
],
"tags": [
"core_v1"
],
"operationId": "readCoreV1NamespacedPod",
"parameters": [
{
"uniqueItems": true,
"type": "boolean",
"description": "Should the export be exact. Exact export maintains cluster-specific fields like 'Namespace'.",
"name": "exact",
"in": "query"
},
{
"uniqueItems": true,
"type": "boolean",
"description": "Should this value be exported. Export strips fields that a user can not specify.",
"name": "export",
"in": "query"
}
],
"responses": {
"200": {
"description": "OK",
"schema": {
"$ref": "#/definitions/v1.Pod"
}
},
"401": {
"description": "Unauthorized"
}
}
}, … } … |
Using this information and the URL of `kube-apiserver`, one should be able to make the call to the given url (/api/v1/namespaces/{namespace}/pods/{name}) with parameters such as `name`, `exact`, `export`, etc. to get pod’s information. Client libraries generators would also use this information to create an API function call for reading pod’s information. For example, python client makes it easy to call this operation like this:
from kubernetes import client ret = client.CoreV1Api().read_namespaced_pod(name="pods_name", namespace="default") |
A simplified version of generated read_namespaced_pod, can be found here.
Swagger-codegen document generator would also be able to create documentation using the same information:
GET /api/v1/namespaces/{namespace}/pods/{name} (readCoreV1NamespacedPod) read the specified Pod Path parameters name (required) Path Parameter— name of the Pod namespace (required) Path Parameter— object name and auth scope, such as for teams and projects Consumes This API call consumes the following media types via the Content-Type request header:
Query parameters pretty (optional) Query Parameter— If 'true', then the output is pretty printed. exact (optional) Query Parameter— Should the export be exact. Exact export maintains cluster-specific fields like 'Namespace'. export (optional) Query Parameter— Should this value be exported. Export strips fields that a user can not specify. Return type v1.Pod
Produces This API call produces the following media types according to the Accept request header; the media type will be conveyed by the Content-Type response header. Responses 200 OK v1.Pod 401 Unauthorized |
There are two ways to access OpenAPI spec:
- From `kuber-apiserver`/swagger.json. This file will have all enabled GroupVersions routes and models and would be most up-to-date file with an specific `kube-apiserver`.
- From Kubernetes GitHub repository with all core GroupVersions enabled. You can access it on master or an specific release (for example 1.5 release).
There are numerous
tools that works with this spec. For example, you can use the
swagger editor to open the spec file and render documentation, as well as generate clients; or you can directly use
swagger codegen to generate documentation and clients. The clients this generates will mostly work out of the box--but you will need some support for authorization and some Kubernetes specific utilities. Use
python client as a template to create your own client.
If you want to get involved in development of OpenAPI support, client libraries, or report a bug, you can get in touch with developers at
SIG-API-Machinery.
--Mehdy Bohlool, Software Engineer, Google
↧
January 9, 2017, 12:00 pm
Editor's note: Today’s post is by Dan Romlein, UX Designer at Apprenda and member of the SIG-UI, sharing UX survey results from the Kubernetes community.
The following infographic summarizes the findings of a survey that the team behind Dashboard, the official web UI for Kubernetes, sent during KubeCon in November 2016. Following the KubeCon launch of the survey, it was promoted on Twitter and various Slack channels over a two week period and generated over 100 responses. We’re delighted with the data it provides us to now make feature and roadmap decisions more in-line with the needs of you, our users.
Satisfaction with Dashboard
Less than a year old, Dashboard is still very early in its development and we realize it has a long way to go, but it was encouraging to hear it’s tracking on the axis of MVP and even with its basic feature set is adding value for people. Respondents indicated that they like how quickly the Dashboard project is moving forward and the activity level of its contributors. Specific appreciation was given for the value Dashboard brings to first-time Kubernetes users and encouraging exploration. Frustration voiced around Dashboard centered on its limited capabilities: notably, the lack of RBAC and limited visualization of cluster objects and their relationships.Respondent DemographicsKubernetes UsagePeople are using Dashboard in production, which is fantastic; it’s that setting that the team is focused on optimizing for.
Feature Priority
![]()
In building Dashboard, we want to continually make alignments between the needs of Kubernetes users and our product. Feature areas have intentionally been kept as high-level as possible, so that UX designers on the Dashboard team can creatively transform those use cases into specific features. While there’s nothing wrong with “faster horses”, we want to make sure we’re creating an environment for the best possible innovation to flourish.
Troubleshooting & Debugging as a strong frontrunner in requested feature area is consistent with the
previous KubeCon survey, and this is now our top area of investment. Currently in-progress is the ability to be able to exec into a Pod, and next up will be providing aggregated logs views across objects. One of a UI’s strengths over a CLI is its ability to show things, and the troubleshooting and debugging feature area is a prime application of this capability.
In addition to a continued ongoing investment in troubleshooting and debugging functionality, the other focus of the Dashboard team’s efforts currently is RBAC / IAM within Dashboard. Though #4 on the ranking of feature areas, In various conversations at KubeCon and the days following, this emerged as a top-requested feature of Dashboard, and the one people were most passionate about. This is a deal-breaker for many companies, and we’re confident its enablement will open many doors for Dashboard’s use in production.
Conclusion
It’s invaluable to have data from Kubernetes users on how they’re putting Dashboard to use and how well it’s serving their needs. If you missed the survey response window but still have something you’d like to share, we’d love to connect with you and hear feedback or answer questions:
↧
↧
January 12, 2017, 10:30 am
Editor's note: Today’s post is by Lucas Käldström an independent Kubernetes maintainer and SIG-Cluster-Lifecycle member, sharing what the group has been building and what’s upcoming.
Last time you heard from us was in September, when we announced kubeadm. The work on making kubeadm a first-class citizen in the Kubernetes ecosystem has continued and evolved. Some of us also met before KubeCon and had a very productive meeting where we talked about what the scopes for our SIG, kubeadm, and kops are.
Continuing to Define SIG-Cluster-Lifecycle
What is the scope for kubeadm?We want kubeadm to be a common set of building blocks for all Kubernetes deployments; the piece that provides secure and recommended ways to bootstrap Kubernetes. Since there is no one true way to setup Kubernetes, kubeadm will support more than one method for each phase. We want to identify the phases every deployment of Kubernetes has in common and make configurable and easy-to-use kubeadm commands for those phases. If your organization, for example, requires that you distribute the certificates in the cluster manually or in a custom way, skip using kubeadm just for that phase. We aim to keep kubeadm useable for all other phases in that case. We want you to be able to pick which things you want kubeadm to do and let you do the rest yourself.
Therefore, the scope for kubeadm is to be easily extendable, modular and very easy to use. Right now, with this v1.5 release we have, kubeadm can only do the “full meal deal” for you. In future versions that will change as kubeadm becomes more componentized, while still leaving the opportunity to do everything for you. But kubeadm will still only handle the bootstrapping of Kubernetes; it won’t ever handle provisioning of machines for you since that can be done in many more ways. In addition, we want kubeadm to work everywhere, even on multiple architectures, therefore we built in multi-architecture support from the beginning.
What is the scope for kops?The scope for kops is to automate full cluster operations: installation, reconfiguration of your cluster, upgrading kubernetes, and eventual cluster deletion. kops has a rich configuration model based on the Kubernetes API Machinery, so you can easily customize some parameters to your needs. kops (unlike kubeadm) handles provisioning of resources for you. kops aims to be the ultimate out-of-the-box experience on AWS (and perhaps other providers in the future). In the future kops will be adopting more and more of kubeadm for the bootstrapping phases that exist. This will move some of the complexity inside kops to a central place in the form of kubeadm.
What is the scope for SIG-Cluster-Lifecycle?The SIG-Cluster-Lifecycle actively tries to simplify the Kubernetes installation and management story. This is accomplished by modifying Kubernetes itself in many cases, and factoring out common tasks. We are also trying to address common problems in the cluster lifecycle (like the name says!). We maintain and are responsible for kubeadm and kops. We discuss problems with the current way to bootstrap clusters on AWS (and beyond) and try to make it easier. We hangout on Slack in the #sig-cluster-lifecycle and #kubeadm channels. We meet and discuss current topics once a week on Zoom. Feel free to come and say hi! Also, don’t be shy to contribute; we’d love your comments and insight!
Looking forward to v1.6
Our goals for v1.6 are centered around refactoring, stabilization and security.
First and foremost, we want to get kubeadm and its composable configuration experience to beta. We will refactor kubeadm so each phase in the bootstrap process is invokable separately. We want to bring the TLS Bootstrap API, the Certificates API and the ComponentConfig API to beta, and to get kops (and other tools) using them.
We will also graduate the token discovery we’re using now (aka. the gcr.io/google_containers/kube-discovery:1.0 image) to beta by adding a new controller to the controller manager: the BootstrapSigner. Using tokens managed as Secrets, that controller will sign the contents (a kubeconfig file) of a well known ConfigMap in a new kube-public namespace. This object will be available to unauthenticated users in order to enable a secure bootstrap with a simple and short shared token.You can read the full proposal here.
In addition to making it possible to invoke phases separately, we will also add a new phase for bringing up the control plane in a self-hosted mode (as opposed to the current static pod technique). The self-hosted technique was developed by CoreOS in the form of bootkube, and will now be incorporated as an alternative into an official Kubernetes product. Thanks to CoreOS for pushing that paradigm forward! This will be done by first setting up a temporary control plane with static pods, injecting the Deployments, ConfigMaps and DaemonSets as necessary, and lastly turning down the temporary control plane. For now, etcd will still be in a static pod by default.
We are supporting self hosting, initially, because we want to support doing patch release upgrades with kubeadm. It should be easy to upgrade from v1.6.2 to v1.6.4 for instance. We consider the built-in upgrade support a critical capability for a real cluster lifecycle tool. It will still be possible to upgrade without self-hosting but it will require more manual work.
On the stabilization front, we want to start running kubeadm e2e tests. In this v1.5 timeframe, we added unit tests and we will continue to increase that coverage. We want to expand this to per-PR e2e tests as well that spin up a cluster with kubeadm init and kubeadm join; runs some kubeadm-specific tests and optionally the Conformance test suite.
Finally, on the security front, we also want to kubeadm to be as secure as possible by default. We look to enable RBAC for v1.6, lock down what kubelet and built-in services like kube-dns and kube-proxy can do, and maybe create specific user accounts that have different permissions.
Regarding releasing, we want to have the official kubeadm v1.6 binary in the kubernetes v1.6 tarball. This means syncing our release with the official one. More details on what we’ve done so far can be found here. As it becomes possible, we aim to move the kubeadm code out to the kubernetes/kubeadm repo (This is blocked on some Kubernetes code-specific infrastructure issues that may take some time to resolve.)
Nice-to-haves for v1.6 would include an official CoreOS Container Linux installer container that does what the debs/rpms are doing for Ubuntu/CentOS. In general, it would be nice to extend the distro support. We also want to adopt Kubelet Dynamic Settings so configuration passed to kubeadm init flows down to nodes automatically (it requires manual configuration currently). We want it to be possible to test Kubernetes from HEAD by using kubeadm.
Through 2017 and beyond
Apart from everything mentioned above, we want kubeadm to simply be a production grade (GA) tool you can use for bootstrapping a Kubernetes cluster. We want HA/multi-master to be much easier to achieve generally than it is now across platforms (though kops makes this easy on AWS today!). We want cloud providers to be out-of-tree and installable separately. kubectl apply -f my-cloud-provider-here.yaml should just work. The documentation should be more robust and should go deeper. Container Runtime Interface (CRI) and Federation should work well with kubeadm. Outdated getting started guides should be removed so new users aren’t mislead.
Refactoring the cloud provider integration pluginsRight now, the cloud provider integrations are built into the controller-manager, the kubelet and the API Server. This combined with the ever-growing interest for Kubernetes makes it unmaintainable to have the cloud provider integrations compiled into the core. Features that are clearly vendor-specific should not be a part of the core Kubernetes project, rather available as an addon from third party vendors. Everything cloud-specific should be moved into one controller, or a few if there’s need. This controller will be maintained by a third-party (usually the company behind the integration) and will implement cloud-specific features. This migration from in-core to out-of-core is disruptive yes, but it has very good side effects: leaner core, making it possible for more than the seven existing clouds to be integrated with Kubernetes and much easier installation. For example, you could run the cloud controller binary in a Deployment and install it with kubectl apply easily.
The plan for v1.6 is to make it possible to:- Create and run out-of-core cloud provider integration controllers
- Ship a new and temporary binary in the Kubernetes release: the cloud-controller-manager. This binary will include the seven existing cloud providers and will serve as a way of validating, testing and migrating to the new flow.
In a future release (v1.9 is proposed), the `--cloud-provider` flag will stop working, and the temporary cloud-controller-manager binary won’t be shipped anymore. Instead, a repository called something like kubernetes/cloud-providers will serve as a place for officially-validated cloud providers to evolve and exist, but all providers there will be independent to each other. (issue #2770; proposal #128; code #3473.)
Changelogs from v1.4 to v1.5
kubeadm
v1.5 is a stabilization release for kubeadm. We’ve worked on making kubeadm more user-friendly, transparent and stable. Some new features have been added making it more configurable.
Here’s a very short extract of what’s changed:
- Made the console output of kubeadm cleaner and more user-friendly#37568
- Implemented kubeadm reset and to drain and cleanup a node #34807 and #37831
- Preflight checks implementation that fails fast if the environment is invalid #34341 and #36334
- kubectl logs and kubectl exec can now be used with kubeadm #37568
- and a lot of other improvements, please read the full changelog.
kopsHere’s a short extract of what’s changed:
- Support for CNI network plugins (Weave, Calico, Kope.io)
- Fully private deployments, where nodes and masters do not have public IPs
- Improved rolling update of clusters, in particular of HA clusters
- OS support for CentOS / RHEL / Ubuntu along with Debian, and support for sysdig & perf tools
Go and check out the
kops releases page in order to get information about the latest and greatest kops release.
Summary
In short, we're excited on the roadmap ahead in bringing a lot of these improvements to you in the coming releases. Which we hope will make the experience to start much easier and lead to increased adoption of Kubernetes.
Thank you for all the feedback and contributions. I hope this has given you some insight in what we’re doing and encouraged you to join us at our meetings to say hi!
-- Lucas Käldström, Independent Kubernetes maintainer and SIG-Cluster-Lifecycle member
↧
January 19, 2017, 2:20 pm
Editor's note: Today’s post is by Harmeet Sahni, Director of Product Management, at Nuage Networks, writing about their contributions to Kubernetes and insights on policy-based networking. Although it’s just been eighteen-months since Kubernetes 1.0 was released, we’ve seen Kubernetes emerge as the leading container orchestration platform for deploying distributed applications. One of the biggest reasons for this is the vibrant open source community that has developed around it. The large number of Kubernetes contributors come from diverse backgrounds means we, and the community of users, are assured that we are investing in an open platform. Companies like Google (Container Engine), Red Hat (OpenShift), and CoreOS (Tectonic) are developing their own commercial offerings based on Kubernetes. This is a good thing since it will lead to more standardization and offer choice to the users. Networking requirements for Kubernetes applicationsFor companies deploying applications on Kubernetes, one of biggest questions is how to deploy and orchestrate containers at scale. They’re aware that the underlying infrastructure, including networking and storage, needs to support distributed applications. Software-defined networking (SDN) is a great fit for such applications because the flexibility and agility of the networking infrastructure can match that of the applications themselves. The networking requirements of such applications include:- Network automation
- Distributed load balancing and service discovery
- Distributed security with fine-grained policies
- QoS Policies
- Scalable Real-time Monitoring
- Hybrid application environments with Services spread across Containers, VMs and Bare Metal Servers
- Service Insertion (e.g. firewalls)
- Support for Private and Public Cloud deployments
Kubernetes NetworkingKubernetes provides a core set of platform services exposed through APIs. The platform can be extended in several ways through the extensions API, plugins and labels. This has allowed a wide variety integrations and tools to be developed for Kubernetes. Kubernetes recognizes that the network in each deployment is going to be unique. Instead of trying to make the core system try to handle all those use cases, Kubernetes chose to make the network pluggable.With Nuage Networks we provide a scalable policy-based SDN platform. The platform is managed by a Network Policy Engine that abstracts away the complexity associated with configuring the system. There is a separate SDN Controller that comes with a very rich routing feature set and is designed to scale horizontally. Nuage uses the open source Open vSwitch (OVS) for the data plane with some enhancements in the OVS user space. Just like Kubernetes, Nuage has embraced openness as a core tenet for its platform. Nuage provides open APIs that allow users to orchestrate their networks and integrate network services such as firewalls, load balancers, IPAM tools etc. Nuage is supported in a wide variety of cloud platforms like OpenStack and VMware as well as container platforms like Kubernetes and others.The Nuage platform implements a Kubernetes network plugin that creates VXLAN overlays to provide seamless policy-based networking between Kubernetes Pods and non-Kubernetes environments (VMs and bare metal servers). Each Pod is given an IP address from a network that belongs to a Namespace and is not tied to the Kubernetes node.As cloud applications are built using microservices, the ability to control traffic among these microservices is a fundamental requirement. It is important to point out that these network policies also need to control traffic that is going to/coming from external networks and services. Nuage’s policy abstraction model makes it easy to declare fine-grained ingress/egress policies for applications. Kubernetes has a beta Network Policy API implemented using the Kubernetes Extensions API. Nuage implements this Network Policy API to address a wide variety of policy use cases such as:- Kubernetes Namespace isolation
- Inter-Namespace policies
- Policies between groups of Pods (Policy Groups) for Pods in same or different Namespaces
- Policies between Kubernetes Pods/Namespaces and external Networks/Services
A key question for users to consider is the scalability of the policy implementation. Some networking setups require creating access control list (ACL) entries telling Pods how they can interact with one another. In most cases, this eventually leads to an n-squared pileup of ACL entries. The Nuage platform avoids this problem and can quickly assign a policy that applies to a whole group of Pods. The Nuage platform implements these policies using a fully distributed stateful firewall based on OVS.
Being able to monitor the traffic flowing between Kubernetes Pods is very useful to both development and operations teams. The Nuage platform’s real-time analytics engine enables visibility and security monitoring for Kubernetes applications. Users can get a visual representation of the traffic flows between groups of Pods, making it easy to see how the network policies are taking effect. Users can also get a rich set of traffic and policy statistics. Further, users can set alerts to be triggered based on policy event thresholds.
ConclusionEven though we started working on our integration with Kubernetes over a year ago, it feels we are just getting started. We have always felt that this is a truly open community and we want to be an integral part of it. You can find out more about our Kubernetes integration on our GitHub page.--Harmeet Sahni, Director of Product Management, Nuage Networks
↧
January 20, 2017, 12:45 pm
Editor's note: Today’s post is by the team at Giant Swarm, showing how they run Kubernetes in Kubernetes.
Giant Swarm’s container infrastructure started out with the goal to be an easy way for developers to deploy containerized microservices. Our first generation was extensively using fleet as a base layer for our infrastructure components as well as for scheduling user containers.
In order to give our users a more powerful way to manage their containers we introduced Kubernetes into our stack in early 2016. However, as we needed a quick way to flexibly spin up and manage different users’ Kubernetes clusters resiliently we kept the underlying fleet layer.
As we insist on running all our underlying infrastructure components in containers, fleet gave us the flexibility of using systemd unit files to define our infrastructure components declaratively. Our self-developed deployment tooling allowed us to deploy and manage the infrastructure without the need for imperative configuration management tools.
However, fleet is just a distributed init and not a complete scheduling and orchestration system. Next to a lot of work on our tooling, it required significant improvements in terms of communication between peers, its reconciliation loop, and stability that we had to work on. Also the uptake in Kubernetes usage would ensure that issues are found and fixed faster.
As we had made good experience with introducing Kubernetes on the user side and with recent developments like rktnetes and stackanetes it felt like time for us to also move our base layer to Kubernetes.
Why Kubernetes in Kubernetes
Now, you could ask, why would anyone want to run multiple Kubernetes clusters inside of a Kubernetes cluster? Are we crazy? The answer is advanced multi-tenancy use cases as well as operability and automation thereof.
Kubernetes comes with its own growing feature set for multi-tenancy use cases. However, we had the goal of offering our users a fully-managed Kubernetes without any limitations to the functionality they would get using any vanilla Kubernetes environment, including privileged access to the nodes. Further, in bigger enterprise scenarios a single Kubernetes cluster with its inbuilt isolation mechanisms is often not sufficient to satisfy compliance and security requirements. More advanced (firewalled) zoning or layered security concepts are tough to reproduce with a single installation. With namespace isolation both privileged access as well as firewalled zones can hardly be implemented without sidestepping security measures.
Now you could go and set up multiple completely separate (and federated) installations of Kubernetes. However, automating the deployment and management of these clusters would need additional tooling and complex monitoring setups. Further, we wanted to be able to spin clusters up and down on demand, scale them, update them, keep track of which clusters are available, and be able to assign them to organizations and teams flexibly. In fact this setup can be combined with a federation control plane to federate deployments to the clusters over one API endpoint.
And wouldn’t it be nice to have an API and frontend for that?
Enter Giantnetes
Based on the above requirements we set out to build what we call Giantnetes - or if you’re into movies, Kubeception. At the most basic abstraction it is an outer Kubernetes cluster (the actual Giantnetes), which is used to run and manage multiple completely isolated user Kubernetes clusters. The physical machines are bootstrapped by using our CoreOS bootstrapping tool, Mayu. The Giantnetes components themselves are self-hosted, i.e. a kubelet is in charge of automatically bootstrapping the components that reside in a manifests folder. You could call this the first level of Kubeception.
Once the Giantnetes cluster is running we use it to schedule the user Kubernetes clusters as well as our tooling for managing and securing them.
We chose Calico as the Giantnetes network plugin to ensure security, isolation, and the right performance for all the applications running on top of Giantnetes.
Then, to create the inner Kubernetes clusters, we initiate a few pods, which configure the network bridge, create certificates and tokens, and launch virtual machines for the future cluster. To do so, we use lightweight technologies such as KVM and qemu to provision CoreOS VMs that become the nodes of an inner Kubernetes cluster. You could call this the second level of Kubeception.
Currently this means we are starting Pods with Docker containers that in turn start VMs with KVM and qemu. However, we are looking into doing this with
rkt qemu-kvm, which would result in using a rktnetes setup for our Giantnetes.
The networking solution for the inner Kubernetes clusters has two levels. It on a combination of flannel’s server/client architecture model and Calico BGP. While a flannel client is used to create the network bridge between the VMs of each virtualized inner Kubernetes cluster, Calico is running inside the virtual machines to connect the different Kubernetes nodes and create a single network for the inner Kubernetes. By using Calico, we mimic the Giantnetes networking solution inside of each Kubernetes cluster and provide the primitives to secure and isolate workloads through the Kubernetes network policy API.
Regarding security, we aim for separating privileges as much as possible and making things auditable. Currently this means we use certificates to secure access to the clusters and encrypt communication between all the components that form a cluster is (i.e. VM to VM, Kubernetes components to each other, etcd master to Calico workers, etc). For this we create a PKI backend per cluster and then issue certificates per service in Vault on-demand. Every component uses a different certificate, thus, avoiding to expose the whole cluster if any of the components or nodes gets compromised. We further rotate the certificates on a regular basis.
For ensuring access to the API and to services of each inner Kubernetes cluster from the outside we run a multi-level HAproxy ingress controller setup in the Giantnetes that connects the Kubernetes VMs to hardware load balancers.
Looking into Giantnetes with kubectl
Let’s have a look at a minimal sample deployment of Giantnetes.
In the above example you see a user Kubernetes cluster `customera` running in VM-containers on top of Giantnetes. We currently use Jobs for the network and certificate setups.
Peeking inside the user cluster, you see the DNS pods and a helloworld running.
Each one of these user clusters can be scheduled and used independently. They can be spun up and down on-demand.
Conclusion
To sum up, we could show how Kubernetes is able to easily not only self-host but also flexibly schedule a multitude of inner Kubernetes clusters while ensuring higher isolation and security aspects. A highlight in this setup is the composability and automation of the installation and the robust coordination between the Kubernetes components. This allows us to easily create, destroy, and reschedule clusters on-demand without affecting users or compromising the security of the infrastructure. It further allows us to spin up clusters with varying sizes and configurations or even versions by just changing some arguments at cluster creation.
This setup is still in its early days and our roadmap is planning for improvements in many areas such as transparent upgrades, dynamic reconfiguration and scaling of clusters, performance improvements, and (even more) security. Furthermore, we are looking forward to improve on our setup by making use of the ever advancing state of Kubernetes operations tooling and upcoming features, such as Init Containers, Scheduled Jobs, Pod and Node affinity and anti-affinity, etc.
Most importantly, we are working on making the inner Kubernetes clusters a third party resource that can then be managed by a custom controller. The result would be much like the Operator concept by CoreOS. And to ensure that the community at large can benefit from this project we will be open sourcing this in the near future.
-- Hector Fernandez, Software Engineer & Puja Abbassi, Developer Advocate, Giant Swarm
↧
January 30, 2017, 8:25 am
Editor's note: Today’s post is by Soam Vasani, Software Engineer at Platform9 Systems, talking about a new open source Serverless Function (FaaS) framework for Kubernetes.
Fission is a Functions as a Service (FaaS) / Serverless function framework built on Kubernetes.
Fission allows you to easily create HTTP services on Kubernetes from functions. It works at the source level and abstracts away container images (in most cases). It also simplifies the Kubernetes learning curve, by enabling you to make useful services without knowing much about Kubernetes.
To use Fission, you simply create functions and add them with a CLI. You can associate functions with HTTP routes, Kubernetes events, or other triggers. Fission supports NodeJS and Python today.
Functions are invoked when their trigger fires, and they only consume CPU and memory when they're running. Idle functions don't consume any resources except storage.
Why make a FaaS framework on Kubernetes?
We think there's a need for a FaaS framework that can be run on diverse infrastructure, both in public clouds and on-premise infrastructure. Next, we had to decide whether to build it from scratch, or on top of an existing orchestration system. It was quickly clear that we shouldn't build it from scratch -- we would just end up having to re-invent cluster management, scheduling, network management, and lots more.
Kubernetes offered a powerful and flexible orchestration system with a comprehensive API backed by a strong and growing community. Building on it meant Fission could leave container orchestration functionality to Kubernetes, and focus on FaaS features.
The other reason we don't want a separate FaaS cluster is that FaaS works best in combination with other infrastructure. For example, it may be the right fit for a small REST API, but it needs to work with other services to store state. FaaS also works great as a mechanism for event handlers to handle notifications from storage, databases, and from Kubernetes itself. Kubernetes is a great platform for all these services to interoperate on top of.
Deploying and Using Fission
Fission can be installed with a `kubectl create` command: see the project README for instructions.
Here's how you’d write a "hello world" HTTP service:
$ cat > hello.py def main(context): print "Hello, world!"
$ fission function create --name hello --env python --code hello.py --route /hello
$ curl http://<fission router>/hello Hello, world! |
Fission takes care of loading the function into a container, routing the request to it, and so on. We go into more details in the next section.
How Fission Is Implemented on Kubernetes
At its core, a FaaS framework must (1) turn functions into services and (2) manage the lifecycle of these services.
There are a number of ways to achieve these goals, and each comes with different tradeoffs. Should the framework operate at the source-level, or at the level of Docker images (or something in-between, like "buildpacks")? What's an acceptable amount of overhead the first time a function runs? Choices made here affect platform flexibility, ease of use, resource usage and costs, and of course, performance.
Packaging, source code, and images
One of our goals is to make Fission very easy to use for new users. We chose to operateat the source level, so that users can avoid having to deal with container image building, pushing images to registries, managing registry credentials, image versioning, and so on.
However, container images are the most flexible way to package apps. A purely source-level interface wouldn't allow users to package binary dependencies, for example.
So, Fission goes with a hybrid approach -- container images that contain a dynamic loader for functions. This approach allows most users to use Fission purely at the source level, but enables them to customize the container image when needed.
These images, called "environment images" in Fission, contain the runtime for the language (such as NodeJS or Python), a set of commonly used dependencies and a dynamic loader for functions. If these dependencies are sufficient for the function the user is writing, no image rebuilding is needed. Otherwise, the list of dependencies can be modified, and the image rebuilt.
These environment images are the only language-specific parts of Fission. They present a uniform interface to the rest of the framework. This design allows Fission to be easily extended to more languages.
Cold start performance
One of the goals of the serverless functions is that functions use CPU/memory resources only when running. This optimizes the resource cost of functions, but it comes at the cost of some performance overhead when starting from idle (the "cold start" overhead).
Cold start overhead is important in many use cases. In particular, with functions used in an interactive use case -- like a web or mobile app, where a user is waiting for the action to complete -- several-second cold start latencies would be unacceptable.
To optimize cold start overheads, Fission keeps a running pool of containers for each environment. When a request for a function comes in, Fission doesn't have to deploy a new container -- it just chooses one that's already running, copies the function into the container, loads it dynamically, and routes the request to that instance. The overhead of this process takes on the order of 100msec for NodeJS and Python functions.
How Fission works on Kubernetes
Fission is designed as a set of microservices. A Controller keeps track of functions, HTTProutes, event triggers, and environment images. A Pool Manager manages pools of idle environment containers, the loading of functions into these containers, and the killing of function instances when they're idle. A Router receives HTTP requests and routes them to function instances, requesting an instance from the Pool Manager if necessary.
The controller serves the fission API. All the other components watch the controller for updates. The router is exposed as a Kubernetes Service of the LoadBalancer or NodePort type, depending on where the Kubernetes cluster is hosted.
When the router gets a request, it looks up a cache to see if this request already has a service it should be routed to. If not, it looks up the function to map the request to, and requests the poolmgr for an instance. The poolmgr has a pool of idle pods; it picks one, loads the function into it (by sending a request into a sidecar container in the pod), and returns the address of the pod to the router. The router proxies over the request to this pod. The pod is cached for subsequent requests, and if it's been idle for a few minutes, it is killed.
(For now, Fission maps one function to one container; autoscaling to multiple instances is planned for a later release. Re-using function pods to host multiple functions is also planned, for cases where isolation isn't a requirement.)
Use Cases for Fission
Bots, Webhooks, REST APIs Fission is a good framework to make small REST APIs, implement webhooks, and write chatbots for Slack or other services.
As an example of a simple REST API, we've made a small guestbook app that uses functions for reading and writing to guestbook, and works with a redis instance to keep track of state. You can find the app in the Fission GitHub repo.
The app contains two end points -- the GET endpoint lists out guestbook entries from redis and renders them into HTML. The POST endpoint adds a new entry to the guestbook list in redis. That’s all there is -- there’s no Dockerfile to manage, and updating the app is as simple as calling fission function update.
Handling Kubernetes EventsFission also supports triggering functions based on Kubernetes watches. For example, you can setup a function to watch for all pods in a certain namespace matching a certain label. The function gets the serialized object and the watch event type (added/removed/updated) in its context.
These event handler functions could be used for simple monitoring -- for example, you could send a slack message whenever a new service is added to the cluster. There are also more complex use cases, such as writing a custom controller by watching Kubernetes' Third Party Resources.
Status and Roadmap
Fission is in early alpha for now (Jan 2017). It's not ready for production use just yet. We're looking for early adopters and feedback.
What's ahead for Fission? We're working on making FaaS on Kubernetes more convenient, easy to use and easier to integrate with. In the coming months we're working on adding support for unit testing, integration with Git, function monitoring and log aggregation. We're also working on integration with other sources of events.
Creating more language environments is also in the works. NodeJS and Python are supported today. Preliminary support for C# .NET has been contributed by Klavs Madsen.
You can find our current roadmap on our GitHub issues and projects.
Get Involved
Fission is open source and developed in the open by Platform9 Systems. Check us out on GitHub, and join our slack channel if you’d like to chat with us. We're also on twitter at @fissionio.
--Soam Vasani, Software Engineer, Platform9 Systems
↧
↧
January 30, 2017, 1:35 pm
Editor's note: Today’s post is by Sandeep Dinesh, Developer Advocate, Google Cloud Platform, showing how to run a database in a container.
Conventional wisdom says you can’t run a database in a container. “Containers are stateless!” they say, and “databases are pointless without state!”
Of course, this is not true at all. At Google, everything runs in a container, including databases. You just need the right tools. Kubernetes 1.5 includes the new StatefulSet API object (in previous versions, StatefulSet was known as PetSet). With StatefulSets, Kubernetes makes it much easier to run stateful workloads such as databases.
If you’ve followed my previous posts, you know how to create a MEAN Stack app with Docker, then migrate it to Kubernetes to provide easier management and reliability, and create a MongoDB replica set to provide redundancy and high availability.
While the replica set in my previous blog post worked, there were some annoying steps that you needed to follow. You had to manually create a disk, a ReplicationController, and a service for each replica. Scaling the set up and down meant managing all of these resources manually, which is an opportunity for error, and would put your stateful application at risk In the previous example, we created a Makefile to ease the management of of these resources, but it would have been great if Kubernetes could just take care of all of this for us.
With StatefulSets, these headaches finally go away. You can create and manage your MongoDB replica set natively in Kubernetes, without the need for scripts and Makefiles. Let’s take a look how.
Note: StatefulSets are currently a beta resource. The sidecar container used for auto-configuration is also unsupported.
Prerequisites and Setup
To create a Kubernetes 1.5 cluster, run the following command:
gcloud container clusters create "test-cluster" |
This will make a three node Kubernetes cluster. Feel free to customize the command as you see fit.
Then, authenticate into the cluster:
gcloud container clusters get-credentials test-cluster |
Setting up the MongoDB replica set
I’ve created the configuration files for these already, and you can clone the example from GitHub:
git clone https://github.com/thesandlord/mongo-k8s-sidecar.git cd example/StatefulSet/ |
To create the MongoDB replica set, run these two commands:
kubectl apply -f googlecloud_ssd.yaml kubectl apply -f mongo-statefulset.yaml |
That's it! With these two commands, you have launched all the components required to run an highly available and redundant MongoDB replica set.
At an high level, it looks something like this:
Let’s examine each piece in more detail.
StorageClass
The storage class tells Kubernetes what kind of storage to use for the database nodes. You can set up many different types of StorageClasses in a ton of different environments. For example, if you run Kubernetes in your own datacenter, you can use
GlusterFS. On GCP, your
storage choices are SSDs and hard disks. There are currently drivers for
AWS,
Azure,
Google Cloud,
GlusterFS,
OpenStack Cinder,
vSphere,
Ceph RBD, and
Quobyte.
The configuration for the StorageClass looks like this:
kind: StorageClass
apiVersion: storage.k8s.io/v1beta1
metadata:
name: fast
provisioner: kubernetes.io/gce-pd
parameters:
type: pd-ssd |
This configuration creates a new StorageClass called “fast” that is backed by SSD volumes. The StatefulSet can now request a volume, and the StorageClass will automatically create it!
Deploy this StorageClass:
kubectl apply -f googlecloud_ssd.yaml |
Headless Service
Now you have created the Storage Class, you need to make a Headless Service. These are just like normal Kubernetes Services, except they don’t do any load balancing for you. When combined with StatefulSets, they can give you unique DNS addresses that let you directly access the pods! This is perfect for creating MongoDB replica sets, because our app needs to connect to all of the MongoDB nodes individually.
The configuration for the Headless Service looks like this:
apiVersion: v1 kind: Service metadata: name: mongo labels: name: mongo spec: ports: - port: 27017 targetPort: 27017 clusterIP: None selector: role: mongo |
You can tell this is a Headless Service because the clusterIP is set to “None.” Other than that, it looks exactly the same as any normal Kubernetes Service.
StatefulSet
The pièce de résistance. The StatefulSet actually runs MongoDB and orchestrates everything together. StatefulSets differ from Kubernetes
ReplicaSets (not to be confused with MongoDB replica sets!) in certain ways that makes them more suited for stateful applications. Unlike Kubernetes ReplicaSets, pods created under a StatefulSet have a few unique attributes. The name of the pod is not random, instead each pod gets an ordinal name. Combined with the Headless Service, this allows pods to have stable identification. In addition, pods are created one at a time instead of all at once, which can help when bootstrapping a stateful system. You can read more about StatefulSets in the
documentation.
Just like before,
this “sidecar” container will configure the MongoDB replica set automatically. A “sidecar” is a helper container which helps the main container do its work.
The configuration for the StatefulSet looks like this:
apiVersion: apps/v1beta1 kind: StatefulSet metadata: name: mongo spec: serviceName: "mongo" replicas: 3 template: metadata: labels: role: mongo environment: test spec: terminationGracePeriodSeconds: 10 containers: - name: mongo image: mongo command: - mongod - "--replSet" - rs0 - "--smallfiles" - "--noprealloc" ports: - containerPort: 27017 volumeMounts: - name: mongo-persistent-storage mountPath: /data/db - name: mongo-sidecar image: cvallance/mongo-k8s-sidecar env: - name: MONGO_SIDECAR_POD_LABELS value: "role=mongo,environment=test" volumeClaimTemplates: - metadata: name: mongo-persistent-storage annotations: volume.beta.kubernetes.io/storage-class: "fast" spec: accessModes: [ "ReadWriteOnce" ] resources: requests: storage: 100Gi |
It’s a little long, but fairly straightforward.
The first second describes the StatefulSet object. Then, we move into the Metadata section, where you can specify labels and the number of replicas.
Next comes the pod spec. The terminationGracePeriodSeconds is used to gracefully shutdown the pod when you scale down the number of replicas, which is important for databases! Then the configurations for the two containers is shown. The first one runs MongoDB with command line flags that configure the replica set name. It also mounts the persistent storage volume to /data/db, the location where MongoDB saves its data. The second container runs the sidecar.
Finally, there is the volumeClaimTemplates. This is what talks to the StorageClass we created before to provision the volume. It will provision a 100 GB disk for each MongoDB replica.
Using the MongoDB replica set
At this point, you should have three pods created in your cluster. These correspond to the three nodes in your MongoDB replica set. You can see them with this command:
kubectl get pods NAME READY STATUS RESTARTS AGE mongo-0 2/2 Running 0 3m mongo-1 2/2 Running 0 3m mongo-2 2/2 Running 0 3m |
Each pod in a StatefulSet backed by a Headless Service will have a stable DNS name. The template follows this format: <pod-name>.<service-name>
This means the DNS names for the MongoDB replica set are:
mongo-0.mongo mongo-1.mongo mongo-2.mongo |
You can use these names directly in the connection string URI of your app.
In this case, the connection string URI would be:
“mongodb://mongo-0.mongo,mongo-1.mongo,mongo-2.mongo:27017/dbname_?” |
That’s it!
Scaling the MongoDB replica set
A huge advantage of StatefulSets is that you can scale them just like Kubernetes ReplicaSets. If you want 5 MongoDB Nodes instead of 3, just run the scale command:
kubectl scale --replicas=5 statefulset mongo |
The sidecar container will automatically configure the new MongoDB nodes to join the replica set.
Include the two new nodes (mongo-3.mongo & mongo-4.mongo) in your connection string URI and you are good to go. Too easy!
Cleaning Up
To clean up the deployed resources, delete the StatefulSet, Headless Service, and the provisioned volumes.
Delete the StatefulSet:
kubectl delete statefulset mongo |
Delete the Volumes:
kubectl delete pvc -l role=mongo |
Finally, you can delete the test cluster:
gcloud container clusters delete "test-cluster" |
Happy Hacking!
For more cool Kubernetes and Container blog posts, follow me on
Twitter and
Medium.
--Sandeep Dinesh, Developer Advocate, Google Cloud Platform.
↧
February 2, 2017, 6:30 am
Today’s post shows how to set-up a reliable, highly available distributed Kubernetes cluster. The support for running such clusters on Google Compute Engine (GCE) was added as an alpha feature in Kubernetes 1.5 release.
Motivation
We will create a Highly Available Kubernetes cluster, with master replicas and worker nodes distributed among three zones of a region. Such setup will ensure that the cluster will continue operating during a zone failure.
Setting Up HA cluster
The following instructions apply to GCE. First, we will setup a cluster that will span over one zone (europe-west1-b), will contain one master and three worker nodes and will be HA-compatible (will allow adding more master replicas and more worker nodes in multiple zones in future). To implement this, we’ll export the following environment variables:
$ export KUBERNETES_PROVIDER=gce $ export NUM_NODES=3 $ export MULTIZONE=true $ export ENABLE_ETCD_QUORUM_READ=true |
and run kube-up script (note that the entire cluster will be initially placed in zone europe-west1-b):
$ KUBE_GCE_ZONE=europe-west1-b ./cluster/kube-up.sh |
Now, we will add two additional pools of worker nodes, each of three nodes, in zones europe-west1-c and europe-west1-d (more details on adding pools of worker nodes can be find here):
$ KUBE_USE_EXISTING_MASTER=true KUBE_GCE_ZONE=europe-west1-c ./cluster/kube-up.sh
$ KUBE_USE_EXISTING_MASTER=true KUBE_GCE_ZONE=europe-west1-d ./cluster/kube-up.sh |
To complete setup of HA cluster, we will add two master replicase, one in zone europe-west1-c, the other in europe-west1-d:
$ KUBE_GCE_ZONE=europe-west1-c KUBE_REPLICATE_EXISTING_MASTER=true ./cluster/kube-up.sh
$ KUBE_GCE_ZONE=europe-west1-d KUBE_REPLICATE_EXISTING_MASTER=true ./cluster/kube-up.sh |
Note that adding the first replica will take longer (~15 minutes), as we need to reassign the IP of the master to the load balancer in front of replicas and wait for it to propagate (see design doc for more details).
Verifying in HA cluster works as intended
We may now list all nodes present in the cluster:
$ kubectl get nodes NAME STATUS AGE kubernetes-master Ready,SchedulingDisabled 48m kubernetes-master-2d4 Ready,SchedulingDisabled 5m kubernetes-master-85f Ready,SchedulingDisabled 32s kubernetes-minion-group-6s52 Ready 39m kubernetes-minion-group-cw8e Ready 48m kubernetes-minion-group-fw91 Ready 48m kubernetes-minion-group-h2kn Ready 31m kubernetes-minion-group-ietm Ready 39m kubernetes-minion-group-j6lf Ready 31m kubernetes-minion-group-soj7 Ready 31m kubernetes-minion-group-tj82 Ready 39m kubernetes-minion-group-vd96 Ready 48m |
As we can see, we have 3 master replicas (with disabled scheduling) and 9 worker nodes.
We will deploy a sample application (nginx server) to verify that our cluster is working correctly:
$ kubectl run nginx --image=nginx --expose --port=80 |
After waiting for a while, we can verify that both the deployment and the service were correctly created and are running:
$ kubectl get pods NAME READY STATUS RESTARTS AGE ... nginx-3449338310-m7fjm 1/1 Running 0 4s ...
$ kubectl run -i --tty test-a --image=busybox /bin/sh If you don't see a command prompt, try pressing enter. # wget -q -O- http://nginx.default.svc.cluster.local ... <title>Welcome to nginx!</title> ... |
Now, let’s simulate failure of one of master’s replicas by executing halt command on it (kubernetes-master-137, zone europe-west1-c):
$ gcloud compute ssh kubernetes-master-2d4 --zone=europe-west1-c ... $ sudo halt |
After a while the master replica will be marked as NotReady:
$ kubectl get nodes NAME STATUS AGE kubernetes-master Ready,SchedulingDisabled 51m kubernetes-master-2d4 NotReady,SchedulingDisabled 8m kubernetes-master-85f Ready,SchedulingDisabled 4m ... |
However, the cluster is still operational. We may verify it by checking if our nginx server works correctly:
$ kubectl run -i --tty test-b --image=busybox /bin/sh If you don't see a command prompt, try pressing enter. # wget -q -O- http://nginx.default.svc.cluster.local ... <title>Welcome to nginx!</title> ... |
We may also run another nginx server:
$ kubectl run nginx-next --image=nginx --expose --port=80 |
The new server should be also working correctly:
$ kubectl run -i --tty test-c --image=busybox /bin/sh If you don't see a command prompt, try pressing enter. # wget -q -O- http://nginx-next.default.svc.cluster.local ... <title>Welcome to nginx!</title> ... |
Let’s now reset the broken replica:
$ gcloud compute instances start kubernetes-master-2d4 --zone=europe-west1-c |
After a while, the replica should be re-attached to the cluster:
$ kubectl get nodes NAME STATUS AGE kubernetes-master Ready,SchedulingDisabled 57m kubernetes-master-2d4 Ready,SchedulingDisabled 13m kubernetes-master-85f Ready,SchedulingDisabled 9m ... |
Shutting down HA cluster
To shutdown the cluster, we will first shut down master replicas in zones D and E:
$ KUBE_DELETE_NODES=false KUBE_GCE_ZONE=europe-west1-c ./cluster/kube-down.sh
$ KUBE_DELETE_NODES=false KUBE_GCE_ZONE=europe-west1-d ./cluster/kube-down.sh |
Note that the second removal of replica will take longer (~15 minutes), as we need to reassign the IP of the load balancer in front of replicas to the remaining master and wait for it to propagate (see design doc for more details).
Then, we will remove the additional worker nodes from zones europe-west1-c and europe-west1-d:
$ KUBE_USE_EXISTING_MASTER=true KUBE_GCE_ZONE=europe-west1-c ./cluster/kube-down.sh
$ KUBE_USE_EXISTING_MASTER=true KUBE_GCE_ZONE=europe-west1-d ./cluster/kube-down.sh |
And finally, we will shutdown the remaining master with the last group of nodes (zone europe-west1-b):
$ KUBE_GCE_ZONE=europe-west1-b ./cluster/kube-down.sh |
Conclusions
We have shown how, by adding worker node pools and master replicas, a Highly Available Kubernetes cluster can be created. As of Kubernetes version 1.5.2, it is supported in kube-up/kube-down scripts for GCE (as alpha). Additionally, there is a support for HA cluster on AWS in kops scripts (see this article for more details).
--Jerzy Szczepkowski, Software Engineer, Google
↧
February 8, 2017, 9:00 am
Editor's note: Today's post is a joint post from the deep learning team at Baidu and the etcd team at CoreOS.
What is PaddlePaddle
PaddlePaddle is an easy-to-use, efficient, flexible and scalable deep learning platform originally developed at Baidu for applying deep learning to Baidu products since 2014.
There have been more than 50 innovations created using PaddlePaddle supporting 15 Baidu products ranging from the search engine, online advertising, to Q&A and system security.
In September 2016, Baidu open sourced PaddlePaddle, and it soon attracted many contributors from outside of Baidu.
Why Run PaddlePaddle on Kubernetes
PaddlePaddle is designed to be slim and independent of computing infrastructure. Users can run it on top of Hadoop, Spark, Mesos, Kubernetes and others.. We have a strong interest with Kubernetes because of its flexibility, efficiency and rich features.
While we are applying PaddlePaddle in various Baidu products, we noticed two main kinds of PaddlePaddle usage -- research and product. Research data does not change often, and the focus is fast experiments to reach the expected scientific measurement. Products data changes often. It usually comes from log messages generated from the Web services.
A successful deep learning project includes both the research and the data processing pipeline. There are many parameters to be tuned. A lot of engineers work on the different parts of the project simultaneously.
To ensure the project is easy to manage and utilize hardware resource efficiently, we want to run all parts of the project on the same infrastructure platform.
The platform should provide:- fault-tolerance. It should abstract each stage of the pipeline as a service, which consists of many processes that provide high throughput and robustness through redundancy.
- auto-scaling. In the daytime, there are usually many active users, the platform should scale out online services. While during nights, the platform should free some resources for deep learning experiments.
- job packing and isolation. It should be able to assign a PaddlePaddle trainer process requiring the GPU, a web backend service requiring large memory, and a CephFS process requiring disk IOs to the same node to fully utilize its hardware.
What we want is a platform which runs the deep learning system, the Web server (e.g., Nginx), the log collector (e.g., fluentd), the distributed queue service (e.g., Kafka), the log joiner and other data processors written using Storm, Spark, and Hadoop MapReduce on the same cluster. We want to run all jobs -- online and offline, production and experiments -- on the same cluster, so we could make full utilization of the cluster, as different kinds of jobs require different hardware resource.
We chose container based solutions since the overhead introduced by VMs is contradictory to our goal of efficiency and utilization.
Based on our research of different container based solutions, Kubernetes fits our requirement the best.
Distributed Training on Kubernetes
PaddlePaddle supports distributed training natively. There are two roles in a PaddlePaddle cluster: parameter server and trainer. Each parameter server process maintains a shard of the global model. Each trainer has its local copy of the model, and uses its local data to update the model. During the training process, trainers send model updates to parameter servers, parameter servers are responsible for aggregating these updates, so that trainers can synchronize their local copy with the global model.
![]() |
| Figure 1: Model is partitioned into two shards. Managed by two parameter servers respectively. |
Some other approaches use a set of parameter servers to collectively hold a very large model in the CPU memory space on multiple hosts. But in practice, it is not often that we have such big models, because it would be very inefficient to handle very large model due to the limitation of GPU memory. In our configuration, multiple parameter servers are mostly for fast communications. Suppose there is only one parameter server process working with all trainers, the parameter server would have to aggregate gradients from all trainers and becomes a bottleneck. In our experience, an experimentally efficient configuration includes the same number of trainers and parameter servers. And we usually run a pair of trainer and parameter server on the same node. In the following Kubernetes job configuration, we start a job that runs N Pods, and in each Pod there are a parameter server and a trainer process.
yaml apiVersion: batch/v1 kind: Job metadata: name: PaddlePaddle-cluster-job spec: parallelism: 3 completions: 3 template: metadata: name: PaddlePaddle-cluster-job spec: volumes: - name: jobpath hostPath: path: /home/admin/efs containers: - name: trainer image: your_repo/paddle:mypaddle command: ["bin/bash", "-c", "/root/start.sh"] env: - name: JOB_NAME value: paddle-cluster-job - name: JOB_PATH value: /home/jobpath - name: JOB_NAMESPACE value: default volumeMounts: - name: jobpath mountPath: /home/jobpath restartPolicy: Never |
We can see from the config that parallelism, completions are both set to 3. So this job will simultaneously start up 3 PaddlePaddle pods, and this job will be finished when all 3 pods finishes.![]() |
Figure 2: Job A of three pods and Job B of one pod running on two nodes. |
The entrypoint of each pod is start.sh. It downloads data from a storage service, so that trainers can read quickly from the pod-local disk space. After downloading completes, it runs a Python script, start_paddle.py, which starts a parameter server, waits until parameter servers of all pods are ready to serve, and then starts the trainer process in the pod.
This waiting is necessary because each trainer needs to talk to all parameter servers, as shown in Figure. 1. Kubernetes API enables trainers to check the status of pods, so the Python script could wait until all parameter servers’ status change to "running" before it triggers the training process.
Currently, the mapping from data shards to pods/trainers is static. If we are going to run N trainers, we would need to partition the data into N shards, and statically assign each shard to a trainer. Again we rely on the Kubernetes API to enlist pods in a job so could we index pods / trainers from 1 to N. The i-th trainer would read the i-th data shard.
Training data is usually served on a distributed filesystem. In practice we use CephFS on our on-premise clusters and Amazon Elastic File System on AWS. If you are interested in building a Kubernetes cluster to run distributed PaddlePaddle training jobs, please follow this tutorial.
What’s Next
We are working on running PaddlePaddle with Kubernetes more smoothly.
As you might notice the current trainer scheduling fully relies on Kubernetes based on a static partition map. This approach is simple to start, but might cause a few efficiency problems.
First, slow or dead trainers block the entire job. There is no controlled preemption or rescheduling after the initial deployment. Second, the resource allocation is static. So if Kubernetes has more available resources than we anticipated, we have to manually change the resource requirements. This is tedious work, and is not aligned with our efficiency and utilization goal.
To solve the problems mentioned above, we will add a PaddlePaddle master that understands Kubernetes API, can dynamically add/remove resource capacity, and dispatches shards to trainers in a more dynamic manner. The PaddlePaddle master uses etcd as a fault-tolerant storage of the dynamic mapping from shards to trainers. Thus, even if the master crashes, the mapping is not lost. Kubernetes can restart the master and the job will keep running.
Another potential improvement is better PaddlePaddle job configuration. Our experience of having the same number of trainers and parameter servers was mostly collected from using special-purpose clusters. That strategy was observed performant on our clients' clusters that run only PaddlePaddle jobs. However, this strategy might not be optimal on general-purpose clusters that run many kinds of jobs.
PaddlePaddle trainers can utilize multiple GPUs to accelerate computations. GPU is not a first class resource in Kubernetes yet. We have to manage GPUs semi-manually. We would love to work with Kubernetes community to improve GPU support to ensure PaddlePaddle runs the best on Kubernetes.
--Yi Wang, Baidu Research and Xiang Li, CoreOS
↧