Quantcast
Channel: Kubernetes – Production-Grade Container Orchestration
Viewing all 290 articles
Browse latest View live

SIG Apps: build apps for and operate them in Kubernetes

$
0
0
Editor’s note: This post is by the Kubernetes SIG-Apps team sharing how they focus on the developer and devops experience of running applications in Kubernetes.

Kubernetes is an incredible manager for containerized applications. Because of this, numerouscompanieshavestarted to run their applications in Kubernetes.

Kubernetes Special Interest Groups (SIGs) have been around to support the community of developers and operators since around the 1.0 release. People organized around networking, storage, scaling and other operational areas.

As Kubernetes took off, so did the need for tools, best practices, and discussions around building and operating cloud native applications. To fill that need the Kubernetes SIG Apps came into existence.

SIG Apps is a place where companies and individuals can:

  • see and share demos of the tools being built to enable app operators
  • learn about and discuss needs of app operators
  • organize around efforts to improve the experience

Since the inception of SIG Apps we’ve had demos of projects like KubeFuse, KPM, and StackSmith. We’ve also executed on a survey of those operating apps in Kubernetes.

From the survey results we’ve learned a number of things including:

  • That 81% of respondents want some form of autoscaling
  • To store secret information 47% of respondents use built-in secrets. At reset these are not currently encrypted. (If you want to help add encryption there is an issue for that.) 
  • The most responded questions had to do with 3rd party tools and debugging
  • For 3rd party tools to manage applications there were no clear winners. There are a wide variety of practices
  • An overall complaint about a lack of useful documentation. (Help contribute to the docs here.)
  • There’s a lot of data. Many of the responses were optional so we were surprised that 935 of all questions across all candidates were filled in. If you want to look at the data yourself it’s available online.

When it comes to application operation there’s still a lot to be figured out and shared. If you've got opinions about running apps, tooling to make the experience better, or just want to lurk and learn about what's going please come join us.


--Matt Farina, Principal Engineer, Hewlett Packard Enterprise


Kubernetes Namespaces: use cases and insights

$
0
0

“Who's on first, What's on second, I Don't Know's on third” 
Who's on First? by Abbott and Costello

Introduction

Kubernetes is a system with several concepts. Many of these concepts get manifested as “objects” in the RESTful API (often called “resources” or “kinds”). One of these concepts is Namespaces. In Kubernetes, Namespaces are the way to partition a single Kubernetes cluster into multiple virtual clusters. In this post we’ll highlight examples of how our customers are using Namespaces. 

But first, a metaphor: Namespaces are like human family names. A family name, e.g. Wong, identifies a family unit. Within the Wong family, one of its members, e.g. Sam Wong, is readily identified as just “Sam” by the family. Outside of the family, and to avoid “Which Sam?” problems, Sam would usually be referred to as “Sam Wong”, perhaps even “Sam Wong from San Francisco”.  

Namespaces are a logical partitioning capability that enable one Kubernetes cluster to be used by multiple users, teams of users, or a single user with multiple applications without concern for undesired interaction. Each user, team of users, or application may exist within its Namespace, isolated from every other user of the cluster and operating as if it were the sole user of the cluster. (Furthermore, Resource Quotas provide the ability to allocate a subset of a Kubernetes cluster’s resources to a Namespace.)

For all but the most trivial uses of Kubernetes, you will benefit by using Namespaces. In this post, we’ll cover the most common ways that we’ve seen Kubernetes users on Google Cloud Platform use Namespaces, but our list is not exhaustive and we’d be interested to learn other examples from you.

Use-cases covered
  1. Roles and Responsibilities in an enterprise for namespaces
  2. Partitioning landscapes: dev vs. test vs. prod
  3. Customer partitioning for non-multi-tenant scenarios
  4. When not to use namespaces
Use-case #1: Roles and Responsibilities in an Enterprise

A typical enterprise contains multiple business/technology entities that operate independently of each other with some form of overarching layer of controls managed by the enterprise itself. Operating a Kubernetes clusters in such an environment can be done effectively when roles and responsibilities pertaining to Kubernetes are defined. 

Below are a few recommended roles and their responsibilities that can make managing Kubernetes clusters in a large scale organization easier.

  1. Designer/Architect role: This role will define the overall namespace strategy, taking into account product/location/team/cost-center and determining how best to map these to Kubernetes Namespaces. Investing in such a role prevents namespace proliferation and “snowflake” Namespaces.
  2. Admin role: This role has admin access to all Kubernetes clusters. Admins can create/delete clusters and add/remove nodes to scale the clusters. This role will be responsible for patching, securing and maintaining the clusters. As well as implementing Quotas between the different entities in the organization. The Kubernetes Admin is responsible for implementing the namespaces strategy defined by the Designer/Architect. 

These two roles and the actual developers using the clusters will also receive support and feedback from the enterprise security and network teams on issues such as security isolation requirements and how namespaces fit this model, or assistance with networking subnets and load-balancers setup.

Anti-patterns
  1. Isolated Kubernetes usage “Islands” without centralized control: Without the initial investment in establishing a centralized control structure around Kubernetes management there is a risk of ending with a “mushroom farm” topology i.e. no defined size/shape/structure of clusters within the org. The result is a difficult to manage, higher risk and elevated cost due to underutilization of resources.
  2. Old-world IT controls choking usage and innovation: A common tendency is to try and transpose existing on-premises controls/procedures onto new dynamic frameworks .This results in weighing down the agile nature of these frameworks and nullifying the benefits of rapid dynamic deployments.
  3. Omni-cluster: Delaying the effort of creating the structure/mechanism for namespace management can result in one large omni-cluster that is hard to peel back into smaller usage groups. 
Use-case #2: Using Namespaces to partition development landscapes

Software development teams customarily partition their development pipelines into discrete units. These units take various forms and use various labels but will tend to result in a discrete dev environment, a testing|QA environment, possibly a staging environment and finally a production environment. The resulting layouts are ideally suited to Kubernetes Namespaces. Each environment or stage in the pipeline becomes a unique namespace.

The above works well as each namespace can be templated and mirrored to the next subsequent environment in the dev cycle, e.g. dev->qa->prod. The fact that each namespace is logically discrete allows the development teams to work within an isolated “development” namespace. DevOps (The closest role at Google is called Site Reliability Engineering“SRE”)  will be responsible for migrating code through the pipelines and ensuring that appropriate teams are assigned to each environment. Ultimately, DevOps is solely responsible for the final, production environment where the solution is delivered to the end-users.

A major benefit of applying namespaces to the development cycle is that the naming of software components (e.g. micro-services/endpoints) can be maintained without collision across the different environments. This is due to the isolation of the Kubernetes namespaces, e.g. serviceX in dev would be referred to as such across all the other namespaces; but, if necessary, could be uniquely referenced using its full qualified name serviceX.development.mycluster.com in the development namespace of mycluster.com.

Anti-patterns
  1. Abusing the namespace benefit resulting in unnecessary environments in the development pipeline. So; if you don’t do staging deployments, don’t create a “staging” namespace.
  2. Overcrowding namespaces e.g. having all your development projects in one huge “development” namespace. Since namespaces attempt to partition, use these to partition by your projects as well. Since Namespaces are flat, you may wish something similar to: projectA-dev, projectA-prod as projectA’s namespaces.
Use-case #3: Partitioning of your Customers

If you are, for example, a consulting company that wishes to manage separate applications for each of your customers, the partitioning provided by Namespaces aligns well. You could create a separate Namespace for each customer, customer project or customer business unit to keep these distinct while not needing to worry about reusing the same names for resources across projects.

An important consideration here is that Kubernetes does not currently provide a mechanism to enforce access controls across namespaces and so we recommend that you do not expose applications developed using this approach externally.

Anti-patterns
  1. Multi-tenant applications don’t need the additional complexity of Kubernetes namespaces since the application is already enforcing this partitioning.
  2. Inconsistent mapping of customers to namespaces. For example, you win business at a global corporate, you may initially consider one namespace for the enterprise not taking into account that this customer may prefer further partitioning e.g. BigCorp Accounting and BigCorp Engineering. In this case, the customer’s departments may each warrant a namespace.
When Not to use Namespaces

In some circumstances Kubernetes Namespaces will not provide the isolation that you need. This may be due to geographical, billing or security factors. For all the benefits of the logical partitioning of namespaces, there is currently no ability to enforce the partitioning. Any user or resource in a Kubernetes cluster may access any other resource in the cluster regardless of namespace. So, if you need to protect or isolate resources, the ultimate namespace is a separate Kubernetes cluster against which you may apply your regular security|ACL controls.

Another time when you may consider not using namespaces is when you wish to reflect a geographically distributed deployment. If you wish to deploy close to US, EU and Asia customers, a Kubernetes cluster deployed locally in each region is recommended.

When fine-grained billing is required perhaps to chargeback by cost-center or by customer, the recommendation is to leave the billing to your infrastructure provider. For example, in Google Cloud Platform (GCP), you could use a separate GCP Project or Billing Account and deploy a Kubernetes cluster to a specific-customer’s project(s).

In situations where confidentiality or compliance require complete opaqueness between customers, a Kubernetes cluster per customer/workload will provide the desired level of isolation. Once again, you should delegate the partitioning of resources to your provider.

Work is underway to provide (a) ACLs on Kubernetes Namespaces to be able to enforce security; (b) to provide Kubernetes Cluster Federation. Both mechanisms will address the reasons for the separate Kubernetes clusters in these anti-patterns. 

An easy to grasp anti-pattern for Kubernetes namespaces is versioning. You should not use Namespaces as a way to disambiguate versions of your Kubernetes resources. Support for versioning is present in the containers and container registries as well as in Kubernetes Deployment resource. Multiple versions should coexist by utilizing the Kubernetes container model which also provides for auto migration between versions with deployments. Furthermore versions scope namespaces will cause massive proliferation of namespaces within a cluster making it hard to manage.

Caveat Gubernator

You may wish to, but you cannot create a hierarchy of namespaces. Namespaces cannot be nested within one another. You can’t, for example, create my-team.my-org as a namespace but could perhaps have team-org.

Namespaces are easy to create and use but it’s also easy to deploy code inadvertently into the wrong namespace. Good DevOps hygiene suggests documenting and automating processes where possible and this will help. The other way to avoid using the wrong namespace is to set a kubectl context

As mentioned previously, Kubernetes does not (currently) provide a mechanism to enforce security across Namespaces. You should only use Namespaces within trusted domains (e.g. internal use) and not use Namespaces when you need to be able to provide guarantees that a user of the Kubernetes cluster or ones its resources be unable to access any of the other Namespaces resources. This enhanced security functionality is being discussed in the Kubernetes Special Interest Group for Authentication and Authorization, get involved at SIG-Auth

--Mike Altarace & Daz Wilkin, Strategic Customer Engineers, Google Cloud Platform


Scaling Stateful Applications using Kubernetes Pet Sets and FlexVolumes with Datera Elastic Data Fabric

$
0
0
Editor’s note: today’s guest post is by Shailesh Mittal, Software Architect and Ashok Rajagopalan, Sr Director Product at Datera Inc, talking about Stateful Application provisioning with Kubernetes on Datera Elastic Data Fabric.

Introduction

Persistent volumes in Kubernetes are foundational as customers move beyond stateless workloads to run stateful applications. While Kubernetes has supported stateful applications such as MySQL, Kafka, Cassandra, and Couchbase for a while, the introduction of Pet Sets has significantly improved this support. In particular, the procedure to sequence the provisioning and startup, the ability to scale and associate durably by Pet Sets has provided the ability to automate to scale the “Pets” (applications that require consistent handling and durable placement). 

Datera, elastic block storage for cloud deployments, has seamlessly integrated with Kubernetes through the FlexVolume framework. Based on the first principles of containers, Datera allows application resource provisioning to be decoupled from the underlying physical infrastructure. This brings clean contracts (aka, no dependency or direct knowledge of the underlying physical infrastructure), declarative formats, and eventually portability to stateful applications.

While Kubernetes allows for great flexibility to define the underlying application infrastructure through yaml configurations, Datera allows for that configuration to be passed to the storage infrastructure to provide persistence. Through the notion of Datera AppTemplates, in a Kubernetes environment, stateful applications can be automated to scale. 


Deploying Persistent Storage

Persistent storage is defined using the Kubernetes PersistentVolume subsystem. PersistentVolumes are volume plugins and define volumes that live independently of the lifecycle of the pod that is using it. They are implemented as NFS, iSCSI, or by cloud provider specific storage system. Datera has developed a volume plugin for PersistentVolumes that can provision iSCSI block storage on the Datera Data Fabric for Kubernetes pods.

The Datera volume plugin gets invoked by kubelets on minion nodes and relays the calls to the Datera Data Fabric over its REST API. Below is a sample deployment of a PersistentVolume with the Datera plugin:

 apiVersion: v1
 kind: PersistentVolume
 metadata:
   name: pv-datera-0
 spec:
   capacity:
     storage: 100Gi
   accessModes:
     - ReadWriteOnce
   persistentVolumeReclaimPolicy: Retain
   flexVolume:
     driver: "datera/iscsi"
     fsType: "xfs"
     options:
       volumeID: "kube-pv-datera-0"
       size: “100"
       replica: "3"
       backstoreServer: "tlx170.tlx.daterainc.com:7717”

This manifest defines a PersistentVolume of 100 GB to be provisioned in the Datera Data Fabric, should a pod request the persistent storage.


[root@tlx241 /]# kubectl get pv
NAME          CAPACITY   ACCESSMODES   STATUS      CLAIM     REASON    AGE
pv-datera-0   100Gi        RWO         Available                       8s
pv-datera-1   100Gi        RWO         Available                       2s
pv-datera-2   100Gi        RWO         Available                       7s
pv-datera-3   100Gi        RWO         Available                       4s

Configuration

The Datera PersistenceVolume plugin is installed on all minion nodes. When a pod lands on a minion node with a valid claim bound to the persistent storage provisioned earlier, the Datera plugin forwards the request to create the volume on the Datera Data Fabric. All the options that are specified in the PersistentVolume manifest are sent to the plugin upon the provisioning request.

Once a volume is provisioned in the Datera Data Fabric, volumes are presented as an iSCSI block device to the minion node, and kubelet mounts this device for the containers (in the pod) to access it.

Using Persistent Storage

Kubernetes PersistentVolumes are used along with a pod using PersistentVolume Claims. Once a claim is defined, it is bound to a PersistentVolume matching the claim’s specification. A typical claim for the PersistentVolume defined above would look like below:


kind: PersistentVolumeClaim
apiVersion: v1
metadata:
 name: pv-claim-test-petset-0
spec:
 accessModes:
   - ReadWriteOnce
 resources:
   requests:
     storage: 100Gi

When this claim is defined and it is bound to a PersistentVolume, resources can be used with the pod specification:


[root@tlx241 /]# kubectl get pv
NAME          CAPACITY   ACCESSMODES   STATUS      CLAIM                            REASON    AGE
pv-datera-0   100Gi      RWO           Bound       default/pv-claim-test-petset-0             6m
pv-datera-1   100Gi      RWO           Bound       default/pv-claim-test-petset-1             6m
pv-datera-2   100Gi      RWO           Available                                              7s
pv-datera-3   100Gi      RWO           Available                                              4s

[root@tlx241 /]# kubectl get pvc
NAME                     STATUS    VOLUME        CAPACITY   ACCESSMODES   AGE
pv-claim-test-petset-0   Bound     pv-datera-0   0                        3m
pv-claim-test-petset-1   Bound     pv-datera-1   0                        3m

A pod can use a PersistentVolume Claim like below:

apiVersion: v1
kind: Pod
metadata:
 name: kube-pv-demo
spec:
 containers:
 - name: data-pv-demo
   image: nginx
   volumeMounts:
   - name: test-kube-pv1
     mountPath: /data
   ports:
   - containerPort: 80
 volumes:
 - name: test-kube-pv1
   persistentVolumeClaim:
     claimName: pv-claim-test-petset-0

The result is a pod using a PersistentVolume Claim as a volume. It in-turn sends the request to the Datera volume plugin to provision storage in the Datera Data Fabric.


[root@tlx241 /]# kubectl describe pods kube-pv-demo
Name:       kube-pv-demo
Namespace:  default
Node:       tlx243/172.19.1.243
Start Time: Sun, 14 Aug 2016 19:17:31 -0700
Labels:     <none>
Status:     Running
IP:         10.40.0.3
Controllers: <none>
Containers:
 data-pv-demo:
   Image:   nginx
   Port:    80/TCP
   State:   Running
     Started:  Sun, 14 Aug 2016 19:17:34 -0700
   Ready:   True
   Restart Count:  0
   Environment Variables:  <none>
Conditions:
 Type           Status
 Initialized    True
 Ready          True
 PodScheduled   True
Volumes:
 test-kube-pv1:
   Type:  PersistentVolumeClaim (a reference to a PersistentVolumeClaim in the same namespace)
   ClaimName:   pv-claim-test-petset-0
   ReadOnly:    false
 default-token-q3eva:
   Type:        Secret (a volume populated by a Secret)
   SecretName:  default-token-q3eva
   QoS Tier:  BestEffort
Events:
 FirstSeenLastSeenCountFromSubobjectPathTypeReasonMessage
 ------------------------------------------------------------
 43s43s1{default-scheduler }NormalScheduledSuccessfully assigned kube-pv-demo to tlx243
 42s42s1{kubelet tlx243}spec.containers{data-pv-demo}NormalPullingpulling image "nginx"
 40s40s1{kubelet tlx243}spec.containers{data-pv-demo}NormalPulledSuccessfully pulled image "nginx"
 40s40s1{kubelet tlx243}spec.containers{data-pv-demo}NormalCreatedCreated container with docker id ae2a50c25e03
 40s40s1{kubelet tlx243}spec.containers{data-pv-demo}NormalStartedStarted container with docker id ae2a50c25e03

The persistent volume is presented as iSCSI device at minion node (tlx243 in this case):

[root@tlx243 ~]# lsscsi
[0:2:0:0]    disk    SMC      SMC2208          3.24  /dev/sda 
[11:0:0:0]   disk    DATERA   IBLOCK           4.0   /dev/sdb

[root@tlx243 datera~iscsi]# mount | grep sdb
/dev/sdb on /var/lib/kubelet/pods/6b99bd2a-628e-11e6-8463-0cc47ab41442/volumes/datera~iscsi/pv-datera-0 type xfs (rw,relatime,attr2,inode64,noquota)

Containers running in the pod see this device mounted at /data as specified in the manifest:

[root@tlx241 /]# kubectl exec kube-pv-demo -c data-pv-demo -it bash
root@kube-pv-demo:/# mount | grep data
/dev/sdb on /data type xfs (rw,relatime,attr2,inode64,noquota)

Using Pet Sets

Typically, pods are treated as stateless units, so if one of them is unhealthy or gets superseded, Kubernetes just disposes it. In contrast, a PetSet is a group of stateful pods that has a stronger notion of identity. The goal of a PetSet is to decouple this dependency by assigning identities to individual instances of an application that are not anchored to the underlying physical infrastructure.

A PetSet requires {0..n-1} Pets. Each Pet has a deterministic name, PetSetName-Ordinal, and a unique identity. Each Pet has at most one pod, and each PetSet has at most one Pet with a given identity. A PetSet ensures that a specified number of “pets” with unique identities are running at any given time. The identity of a Pet is comprised of:
  • a stable hostname, available in DNS
  • an ordinal index
  • stable storage: linked to the ordinal & hostname
A typical PetSet definition using a PersistentVolume Claim looks like below:

# A headless service to create DNS records
apiVersion: v1
kind: Service
metadata:
 name: test-service
 labels:
   app: nginx
spec:
 ports:
 - port: 80
   name: web
 clusterIP: None
 selector:
   app: nginx
---
apiVersion: apps/v1alpha1
kind: PetSet
metadata:
 name: test-petset
spec:
 serviceName: "test-service"
 replicas: 2
 template:
   metadata:
     labels:
       app: nginx
     annotations:
   spec:
     terminationGracePeriodSeconds: 0
     containers:
     - name: nginx
       ports:
       - containerPort: 80
         name: web
       volumeMounts:
       - name: pv-claim
         mountPath: /data
 volumeClaimTemplates:
 - metadata:
     name: pv-claim
     annotations:
   spec:
     accessModes: [ "ReadWriteOnce" ]
     resources:
       requests:
         storage: 100Gi

We have the following PersistentVolume Claims available:

[root@tlx241 /]# kubectl get pvc
NAME                     STATUS    VOLUME        CAPACITY   ACCESSMODES   AGE
pv-claim-test-petset-0   Bound     pv-datera-0   0                        41m
pv-claim-test-petset-1   Bound     pv-datera-1   0                        41m
pv-claim-test-petset-2   Bound     pv-datera-2   0                        5s
pv-claim-test-petset-3   Bound     pv-datera-3   0                        2s

When this PetSet is provisioned, two pods get instantiated:

[root@tlx241 /]# kubectl get pods
NAMESPACE     NAME                        READY     STATUS    RESTARTS   AGE
default       test-petset-0               1/1       Running   0          7s
default       test-petset-1               1/1       Running   0          3s

Here is how the PetSet test-petset instantiated earlier looks like:


[root@tlx241 /]# kubectl describe petset test-petset
Name:test-petset
Namespace:default
Selector:app=nginx
Labels:app=nginx
Replicas:2 current / 2 desired
Annotations:<none>
CreationTimestamp:Sun, 14 Aug 2016 19:46:30 -0700
Pods Status:2 Running / 0 Waiting / 0 Succeeded / 0 Failed
No volumes.
No events.

Once a PetSet is instantiated, such as test-petset below, upon increasing the number of replicas (i.e. the number of pods started with that PetSet), more pods get instantiated and more PersistentVolume Claims get bound to new pods:

[root@tlx241 /]# kubectl patch petset test-petset -p'{"spec":{"replicas":"3"}}'
"test-petset” patched

[root@tlx241 /]# kubectl describe petset test-petset
Name:test-petset
Namespace:default
Selector:app=nginx
Labels:app=nginx
Replicas:3 current / 3 desired
Annotations:<none>
CreationTimestamp:Sun, 14 Aug 2016 19:46:30 -0700
Pods Status:3 Running / 0 Waiting / 0 Succeeded / 0 Failed
No volumes.
No events.

[root@tlx241 /]# kubectl get pods
NAME                        READY     STATUS    RESTARTS   AGE
test-petset-0               1/1       Running   0          29m
test-petset-1               1/1       Running   0          28m
test-petset-2               1/1       Running   0          9s

Now the PetSet is running 3 pods after patch application.

When the above PetSet definition is patched to have one more replica, it introduces one more pod in the system. This in turn results in one more volume getting provisioned on the Datera Data Fabric. So volumes get dynamically provisioned and attached to a pod upon the PetSet scaling up.

To support the notion of durability and consistency, if a pod moves from one minion to another, volumes do get attached (mounted) to the new minion node and detached (unmounted) from the old minion to maintain persistent access to the data.

Conclusion

This demonstrates Kubernetes with Pet Sets orchestrating stateful and stateless workloads. While the Kubernetes community is working on expanding the FlexVolume framework’s capabilities, we are excited that this solution makes it possible for Kubernetes to be run more widely in the datacenters. 

Join and contribute: Kubernetes Storage SIG.


Security Best Practices for Kubernetes Deployment

$
0
0
Editor’s note: today’s post is by Amir Jerbi and Michael Cherny of Aqua Security, describing security best practices for Kubernetes deployments, based on data they’ve collected from various use-cases seen in both on-premises and cloud deployments. 

Kubernetes provides many controls that can greatly improve your application security. Configuring them requires intimate knowledge with Kubernetes and the deployment’s security requirements. The best practices we highlight here are aligned to the container lifecycle: build, ship and run, and are specifically tailored to Kubernetes deployments. We adopted these best practices in our own SaaS deployment that runs Kubernetes on Google Cloud Platform.

The following are our recommendations for deploying a secured Kubernetes application:

Ensure That Images Are Free of Vulnerabilities 
Having running containers with vulnerabilities opens your environment to the risk of being easily compromised. Many of the attacks can be mitigated simply by making sure that there are no software components that have known vulnerabilities.

  • Implement Continuous Security Vulnerability Scanning -- Containers might include outdated packages with known vulnerabilities (CVEs). This cannot be a ‘one off’ process, as new vulnerabilities are published every day. An ongoing process, where images are continuously assessed, is crucial to insure a required security posture. 
  • Regularly Apply Security Updates to Your Environment -- Once vulnerabilities are found in running containers, you should always update the source image and redeploy the containers. Try to avoid direct updates (e.g. ‘apt-update’) to the running containers, as this can break the image-container relationship. Upgrading containers is extremely easy with the Kubernetes rolling updates feature - this allows gradually updating a running application by upgrading its images to the latest version.

Ensure That Only Authorized Images are Used in Your Environment

Without a process that ensures that only images adhering to the organization’s policy are allowed to run, the organization is open to risk of running vulnerable or even malicious containers. Downloading and running images from unknown sources is dangerous. It is equivalent to running software from an unknown vendor on a production server. Don’t do that.

Use private registries to store your approved images - make sure you only push approved images to these registries. This alone already narrows the playing field, reducing the number of potential images that enter your pipeline to a fraction of the hundreds of thousands of publicly available images. Build a CI pipeline that integrates security assessment (like vulnerability scanning), making it part of the build process.  

The CI pipeline should ensure that only vetted code (approved for production) is used for building the images. Once an image is built, it should be scanned for security vulnerabilities, and only if no issues are found then the image would be pushed to a private registry, from which deployment to production is done. A failure in the security assessment should create a failure in the pipeline, preventing images with bad security quality from being pushed to the image registry.

There is work in progress being done in Kubernetes for image authorization plugins (expected in Kubernetes 1.4), which will allow preventing the shipping of unauthorized images. For more info see this pull request.

Limit Direct Access to Kubernetes Nodes
You should limit SSH access to Kubernetes nodes, reducing the risk for unauthorized access to host resource. Instead you should ask users to use "kubectl exec", which will provide direct access to the container environment without the ability to access the host.

You can use Kubernetes Authorization Plugins to further control user access to resources. This allows defining fine-grained-access control rules for specific namespace, containers and operations.

Create Administrative Boundaries between Resources
Limiting the scope of user permissions can reduce the impact of mistakes or malicious activities. A Kubernetes namespace allows you to partition created resources into logically named groups. Resources created in one namespace can be hidden from other namespaces. By default, each resource created by a user in Kubernetes cluster runs in a default namespace, called default. You can create additional namespaces and attach resources and users to them. You can use Kubernetes Authorization plugins to create policies that segregate access to namespace resources between different users.

For example: the following policy will allow ‘alice’ to read pods from namespace ‘fronto’.

{
 "apiVersion": "abac.authorization.kubernetes.io/v1beta1",
 "kind": "Policy",
 "spec": {
   "user": "alice",
   "namespace": "fronto",
   "resource": "pods",
   "readonly": true
 }
}

Define Resource Quota
An option of running resource-unbound containers puts your system in risk of DoS or “noisy neighbor” scenarios. To prevent and minimize those risks you should define resource quotas. By default, all resources in Kubernetes cluster are created with unbounded CPU and memory requests/limits. You can create resource quota policies, attached to Kubernetes namespace, in order to limit the CPU and memory a pod is allowed to consume.

The following is an example for namespace resource quota definition that will limit number of pods in the namespace to 4, limiting their CPU requests between 1 and 2 and memory requests between 1GB to 2GB.

compute-resources.yaml:


apiVersion: v1
kind: ResourceQuota
metadata:
 name: compute-resources
spec:
 hard:
   pods: "4"
   requests.cpu: "1"
   requests.memory: 1Gi
   limits.cpu: "2"
   limits.memory: 2Gi

Assign a resource quota to namespace:


kubectl create -f ./compute-resources.yaml --namespace=myspace

Implement Network Segmentation
Running different applications on the same Kubernetes cluster creates a risk of one compromised application attacking a neighboring application. Network segmentation is important to ensure that containers can communicate only with those they are supposed to. 
One of the challenges in Kubernetes deployments is creating network segmentation between pods, services and containers. This is a challenge due to the “dynamic” nature of container network identities (IPs), along with the fact that containers can communicate both inside the same node or between nodes.

Users of Google Cloud Platform can benefit from automatic firewall rules, preventing cross-cluster communication. A similar implementation can be deployed on-premises using network firewalls or SDN solutions. There is work being done in this area by the Kubernetes Network SIG, which will greatly improve the pod-to-pod communication policies. A new network policy API should address the need to create firewall rules around pods, limiting the network access that a containerized can have.

The following is an example of a network policy that controls the network for “backend” pods, only allowing inbound network access from “frontend” pods:


POST /apis/net.alpha.kubernetes.io/v1alpha1/namespaces/tenant-a/networkpolicys
{
 "kind": "NetworkPolicy",
 "metadata": {
   "name": "pol1"
 },
 "spec": {
   "allowIncoming": {
     "from": [{
       "pods": { "segment": "frontend" }
     }],
     "toPorts": [{
       "port": 80,
       "protocol": "TCP"
     }]
   },
   "podSelector": {
     "segment": "backend"
   }
 }
}

Read more about Network policies here.

Apply Security Context to Your Pods and Containers
When designing your containers and pods, make sure that you configure the security context for your pods, containers and volumes. A security context is a property defined in the deployment yaml. It controls the security parameters that will be assigned to the pod/container/volume. Some of the important parameters are:


Security Context Setting
Description
SecurityContext->runAsNonRoot
Indicates that containers should run as non-root user
SecurityContext->Capabilities
Controls the Linux capabilities assigned to the container.
SecurityContext->readOnlyRootFilesystem
Controls whether a container will be able to write into the root filesystem.
PodSecurityContext->runAsNonRoot
Prevents running a container with ‘root’ user as part of the pod


The following is an example for pod definition with security context parameters:


apiVersion: v1
kind: Pod
metadata:
 name: hello-world
spec:
 containers:
 # specification of the pod’s containers
 # ...
 securityContext:
   readOnlyRootFilesystem: true
   runAsNonRoot: true

Reference here

In case you are running containers with elevated privileges (--privileged) you should consider using the “DenyEscalatingExec” admission control. This control denies exec and attach commands to pods that run with escalated privileges that allow host access. This includes pods that run as privileged, have access to the host IPC namespace, and have access to the host PID namespace. For more details on admission controls, see the Kubernetes documentation

Log Everything
Kubernetes supplies cluster-based logging, allowing to log container activity into a central log hub. When a cluster is created, the standard output and standard error output of each container can be ingested using a Fluentd agent running on each node into either Google Stackdriver Logging or into Elasticsearch and viewed with Kibana.

Summary
Kubernetes supplies many options to create a secured deployment. There is no one-size-fit-all solution that can be used everywhere, so a certain degree of familiarity with these options is required, as well as an understanding of how they can enhance your application’s security.

We recommend implementing the best practices that were highlighted in this blog, and use Kubernetes flexible configuration capabilities to incorporate security processes into the continuous integration pipeline, automating the entire process with security seamlessly “baked in”.


--Michael Cherny, Head of Security Research, and Amir Jerbi, CTO and co-founder Aqua Security


Cloud Native Application Interfaces

$
0
0

Standard Interfaces (or, the Thirteenth Factor)
--by Brian Grant and Craig Mcluckie, Google

When you say we need ‘software standards’ in erudite company, you get some interesting looks. Most concede that software standards have been central to the success of the boldest and most successful projects out there (like the Internet). Most are also skeptical about how they apply to the innovative world we live in today. Our projects are executed in week increments, not years. Getting bogged down behind mega-software-corporation-driven standards practices would be the death knell in this fluid, highly competitive world.

This isn’t about ‘those’ standards. The ones that emerge after years of deep consideration and negotiation that are eventually published by a body with a four-letter acronym for a name. This is about a different approach: finding what is working in the real world, and acting as a community to embrace it.

Let’s go back to first principles. To describe Cloud Native in one word, we'd choose "automatable".

Most existing applications are not. 

Applications have many interfaces with their environment, whether with management infrastructure, shared services, or other applications. For us to remove the operator from patching, scaling, migrating an app from one environment to another, changing out dependencies, and handling of failure conditions, a set of well structured common interfaces is essential. It goes without saying that these interfaces must be designed for machines, not just humans. Machine-friendly interfaces allow automation systems to understand the systems under management, and create the loose coupling needed for applications to live in automated environments. 

As containerized infrastructure gets built there are a set of critical interfaces available to applications that go far beyond what is available to a single node today. The adoption of ‘serverless patterns’ (meaning ephemeral, event driven function execution) will further compound the need to make sense of running code in an environment that is completely decoupled from the node. The services needed will start with application configuration and extend to monitoring, logging, autoscaling and beyond. The set of capabilities will only grow as applications continue to adapt to be fuller citizens in a "cloud native" world.

Exploring one example a little further, a number of service-discovery solutions have been developed but are often tied to a particular storage implementation, a particular programming language, a non-standard protocol, and/or are opinionated in some other way (e.g., dictating application naming structure). This makes them unsuitable for general-purpose use. While DNS has limitations (that will eventually need to be addressed), it's at least a standard protocol with room for innovation in its implementation. This is demonstrated by CoreDNS and other cloud-native DNS implementations. 

When we look inside the systems at Google, we have been able to achieve very high levels of automation without formal interface definitions thanks to a largely homogeneous software and hardware environment. Adjacent systems can safely make assumptions about interfaces, and by providing a set of universally used libraries we can skirt the issue. A good example of this is our log format doesn’t need to be formally specified because the libraries that generate logs are maintained by the teams that maintain the logs processing systems. This means that we have been able to get by to date without something like fluentd (which is solving the problem in the community of interfacing with logging systems).

Even though Google has managed to get by this way, it hurts us. One way is when we acquire a company. Porting their technology to run in our automation systems requires a spectacular amount of work. Doing that work while continuing to innovate is particularly tough. Even more significant though, there’s a lot of innovation happening in the open source world that isn’t easy for us to tap into. When new technology emerges, we would like to be able to experiment with it, adopt it piecemeal, and perhaps contribute back to it. When you run a vertically integrated, bespoke stack, that is a hard thing to do.

The lack of standard interfaces leaves customers with three choices: 
  1. Live with high operations cost (the status quo), and accept that your developers in many cases will spend the majority of their time dealing with the care and feeding of applications.
  2. Sign-up to be like Google (build your own everything, down to the concrete in the floor). 
  3. Rely on a single, or a small collection of vendors to provide a complete solution and accept some degree of lock-in. Few in companies of any size (from enterprise to startup) find this appealing.
It is our belief that an open community is more powerful and that customers benefit when there is competition at every layer of the stack. It should be possible to pull together a stack with best-of-breed capabilities at every level -- logging, monitoring, orchestration, container runtime environment, block and file-system storage, SDN technology, etc. 

Standardizing interfaces (at least by convention) between the management system and applications is critical. One might consider the use of common conventions for interfaces as a thirteenth factor (expanding on the 12-factor methodology) in creating modern systems that work well in the cloud and at scale.

Kubernetes and Cloud Native Computing Foundation (CNCF) represent a great opportunity to support the emergence of standard interfaces, and to support the emergence of a fully automated software world. We’d love to see this community embrace the ideal of promoting standard interfaces from working technology. The obvious first step is to identify the immediate set of critical interfaces, and establish working groups in CNCF to start assess what exists in this area as candidates, and to sponsor work to start developing standard interfaces that work across container formats, orchestrators, developer tools and the myriad other systems that are needed to deliver on the Cloud Native vision.

--Brian Grant and Craig Mcluckie, Google


Deploying to Multiple Kubernetes Clusters with kit

$
0
0
Editor’s note: today’s guest post is by Chesley Brown, Full-Stack Engineer, at InVision, talking about how they build and open sourced kit to help them to continuously deploy updates to multiple clusters.

Our Docker journey at InVision may sound familiar. We started with Docker in our development environments, trying to get consistency there first. We wrangled our legacy monolith application into Docker images and streamlined our Dockerfiles to minimize size and amp the efficiency. Things were looking good. Did we learn a lot along the way? For sure. But at the end of it all, we had our entire engineering team working with Docker locally for their development environments. Mission accomplished! Well, not quite. Development was one thing, but moving to production was a whole other ballgame.

Along Came Kubernetes

Kubernetes came into our lives during our evaluation of orchestrators and schedulers last December. AWS ECS was still fresh and Docker had just released 1.9 (networking overlay release). We spent the month evaluating our choices, narrowing it down to native Docker tooling (Machine, Swarm, Compose), ECS and Kubernetes. Well, needless to say, Kubernetes was our clear winner and we started the new year moving headlong to leverage Kubernetes to get us to production. But it wasn't long when we ran into a tiny complication...

Automated Deployments With A Catch

Here at InVision, we have a unique challenge. We just don’t have a single production environment running Kubernetes, but several, all needing automated updates via our CI/CD process. And although the code running on these environments was similar, the configurations were not. Things needed to work smoothly, automatically, as we couldn't afford to add friction to the deploy process or encumber our engineering teams.

Having several near duplicate clusters could easily turn into a Kubernetes manifest nightmare. Anti-patterns galore, as we copy and paste 95% of the manifests to get a new cluster. Scalable? No. Headache? Yes. Keeping those manifests up-to-date and accurate would be a herculean (and error-prone) task. We needed something easier, something that allows reuse, keeping the maintenance low, and that we could incorporate into our CI/CD system.

So after looking for a project or tooling that could fit our needs, we came up empty. At InVision, we love to create tools to help us solve problems, and figuring we may not be the only team in this situation we decided to roll up our sleeves and created something of our own. The result is our open-source tool, kit! (short for Kubernetes + git)

Hello kit!

kit is a suite of components that, when plugged into your CI/CD system and source control, allows you to continuously deploy updates (or entirely new services!) to as many clusters as needed, all leveraging webhooks and without having to host an external service.

Using kit’s templating format, you can define your service files once and have them reused across multiple clusters. It works by building on top of your usual Kubernetes manifest files allowing them to be defined once and then reused across clusters by only defining the unique configuration needed for that specific cluster. This allows you to easily build the orchestration for your application and deploy it to as many clusters as needed. It also allows the ability to group variations of your application so you could have clusters that run the “development” version of your application while others run the “production” version and so on.

Developers simply commit code to their branches as normal and kit deploys to all clusters running that service. Kit then manages updating the image and tag that is used for a given service directly to the repository containing all your kit manifest templates. This means any and all changes to your clusters, from environment variables, or configurations to image updates are all tracked under source control history providing you with an audit trail for every cluster you have.

We made all of this Open Source so you can check out the kit repo!

Is kit Right For Us?

If you are running Kubernetes across several clusters (or namespaces) all needing to continuously deploy, you bet! Because using kit doesn’t require hosting any external server, your team can leverage the webhooks you probably already have with github and your CI/CD system to get started. From there you create a repo to host your Kubernetes manifest files which tells what services are deployed to which clusters. Complexity of these files is greatly simplified thanks to kit’s templating engine.The kit-image-deployer component is incorporated into the CI/CD process and whenever a developer commits code to master and the build passes, it’s automatically deployed to all configured clusters.

So What Are The Components?

kit is comprised of several components each building on the next. The general flow is a developer commits code to their repository, an image is built and then kit-image-deployer commits the new image and tag to your manifests repository. From there the kit-deploymentizer runs, parsing all your manifest templates to generate the raw Kubernetes manifest files. Finally the kit-deployer runs and takes all the built manifest files and deploys them to all the appropriate clusters. Here is a summary of the components and the flow:

kit-image-deployer
A service that can be used to update given yaml files within a git repository with a new Docker image path. This can be used in collaboration with kit-deploymentizer and kit-deployer to automatically update the images used for a service across multiple clusters.

kit-deploymentizer
This service intelligently builds deployment files as to allow reusability of environment variables and other forms of configuration. It also supports aggregating these deployments for multiple clusters. In the end, it generates a list of clusters and a list of deployment files for each of these clusters. Best used in collaboration with kit-deployer and kit-image-deployer to achieve a continuous deployment workflow.

kit-deployer
Use this service to deploy files to multiple Kubernetes clusters. Just organize your manifest files into directories that match the names of your clusters (the name defined in your kubeconfig files). Then you provide a directory of kubeconfig files and the kit-deployer will asynchronously send all manifests up to their corresponding clusters.

So What's Next?

In the near future, we want to make deployments even smarter so as to handle updating things like mongo replicasets. We also want to add in smart monitoring to further improve on the self-healing nature of Kubernetes. We’re also working on adding additional integrations (such as Slack) and notification methods. And most importantly we’re working towards shifting more control to the individual developers of each service by allowing the kit manifest templates to exist in each individual service repository instead of a single master manifest repository. This will allow them to manage their service completely from development straight to production across all clusters.

We hope you take a closer look at kit and tell us what you think! Check out our InVision Engineering blog for more posts about the cool things we are up to at InVision. If you want to work on kit or other interesting things like this, click through to our jobs page. We'd love to hear from you!


--Chesley Brown, Full-Stack Engineer, at InVision.

Creating a PostgreSQL Cluster using Helm

$
0
0
Editor’s note: Today’s guest post is by Jeff McCormick, a developer at Crunchy Data, showing how to deploy a PostgreSQL cluster using Helm, a Kubernetes package manager.

Crunchy Data supplies a set of open source PostgreSQL and PostgreSQL related containers. The Crunchy PostgreSQL Container Suite includes containers that deploy, monitor, and administer the open source PostgreSQL database, for more details view this GitHub repository

In this post we’ll show you how to deploy a PostgreSQL cluster using Helm, a Kubernetes package manager. For reference, the Crunchy Helm Chart examples used within this post are located here, and the pre-built containers can be found on DockerHub at this location

This example will create the following in your Kubernetes cluster:
  • postgres master service
  • postgres replica service
  • postgres 9.5 master database (pod)
  • postgres 9.5 replica database (replication controller)


HelmBlogDiagram.jpg

This example creates a simple Postgres streaming replication deployment with a master (read-write), and a single asynchronous replica (read-only). You can scale up the number of replicas dynamically.

Contents

The example is made up of various Chart files as follows:


values.yaml
This file contains values which you can reference within the database templates allowing you to specify in one place values like database passwords
templates/master-pod.yaml
The postgres master database pod definition.  This file causes a single postgres master pod to be created.
templates/master-service.yaml
The postgres master database has a service created to act as a proxy.  This file causes a single service to be created to proxy calls to the master database.
templates/replica-rc.yaml
The postgres replica database is defined by this file.  This file causes a replication controller to be created which allows the postgres replica containers to be scaled up on-demand.
templates/replica-service.yaml
This file causes the service proxy for the replica database container(s) to be created.

Installation

Install Helm according to their GitHub documentation and then install the examples as follows:


helm init
cd crunchy-containers/examples/kubehelm
helm install ./crunchy-postgres

Testing

After installing the Helm chart, you will see the following services:

kubectl get services
NAME              CLUSTER-IP   EXTERNAL-IP   PORT(S)    AGE
crunchy-master    10.0.0.171   <none>        5432/TCP   1h
crunchy-replica   10.0.0.31    <none>        5432/TCP   1h
kubernetes        10.0.0.1     <none>        443/TCP    1h

It takes about a minute for the replica to begin replicating with the master. To test out replication, see if replication is underway with this command, enter password for the password when prompted:

psql -h crunchy-master -U postgres postgres -c 'table pg_stat_replication'

If you see a line returned from that query it means the master is replicating to the slave. Try creating some data on the master:


psql -h crunchy-master -U postgres postgres -c 'create table foo (id int)'
psql -h crunchy-master -U postgres postgres -c 'insert into foo values (1)'


Then verify that the data is replicated to the slave:


psql -h crunchy-replica -U postgres postgres -c 'table foo'

You can scale up the number of read-only replicas by running the following kubernetes command:

kubectl scale rc crunchy-replica --replicas=2

It takes 60 seconds for the replica to start and begin replicating from the master.  

The Kubernetes Helm and Charts projects provide a streamlined way to package up complex applications and deploy them on a Kubernetes cluster.  Deploying PostgreSQL clusters can sometimes prove challenging, but the task is greatly simplified using Helm and Charts.

--Jeff McCormick, Developer, Crunchy Data


High performance network policies in Kubernetes clusters

$
0
0
Editor's note: today’s post is by Juergen Brendel, Pritesh Kothari and Chris Marino co-founders of Pani Networks, the sponsor of the Romana project, the network policy software used for these benchmark tests.

Network Policies

Since the release of Kubernetes 1.3 back in July, users have been able to define and enforce network policies in their clusters. These policies are firewall rules that specify permissible types of traffic to, from and between pods. If requested, Kubernetes blocks all traffic that is not explicitly allowed. Policies are applied to groups of pods identified by common labels. Labels can then be used to mimic traditional segmented networks often used to isolate layers in a multi-tier application: You might identify your front-end and back-end pods by a specific “segment” label, for example. Policies control traffic between those segments and even traffic to or from external sources.

Segmenting traffic

What does this mean for the application developer? At last, Kubernetes has gained the necessary capabilities to provide "defence in depth". Traffic can be segmented and different parts of your application can be secured independently. For example, you can very easily protect each of your services via specific network policies: All the pods identified by a Replication Controller behind a service are already identified by a specific label. Therefore, you can use this same label to apply a policy to those pods.

Defense in depth has long been recommended as best practice. This kind of isolation between different parts or layers of an application is easily achieved on AWS and OpenStack by applying security groups to VMs. 

However, prior to network policies, this kind of isolation for containers was not possible. VXLAN overlays can provide simple network isolation, but application developers need more fine grained control over the traffic accessing pods. As you can see in this simple example, Kubernetes network policies can manage traffic based on source and origin, protocol and port.


apiVersion: extensions/v1beta1
kind: NetworkPolicy
metadata:
name: pol1
spec:
podSelector:
  matchLabels:
    role: backend
ingress:
- from:
  - podSelector:
     matchLabels:
      role: frontend
  ports:
  - protocol: tcp
    port: 80


Not all network backends support policies

Network policies are an exciting feature, which the Kubernetes community has worked on for a long time. However, it requires a networking backend that is capable of applying the policies. By themselves, simple routed networks or the commonly used flannel network driver, for example, cannot apply network policy.

There are only a few policy-capable networking backends available for Kubernetes today: RomanaCalico, and Canal; with Weave indicating support in the near future. Red Hat’s OpenShift includes network policy features as well.

We chose Romana as the back-end for these tests because it configures pods to use natively routable IP addresses in a full L3 configuration. Network policies, therefore, can be applied directly by the host in the Linux kernel using iptables rules. This results is a high performance, easy to manage network. 

Testing performance impact of network policies

After network policies have been applied, network packets need to be checked against those policies to verify that this type of traffic is permissible. But what is the performance penalty for applying a network policy to every packet? Can we use all the great policy features without impacting application performance? We decided to find out by running some tests.

Before we dive deeper into these tests, it is worth mentioning that ‘performance’ is a tricky thing to measure, network performance especially so. 

Throughput (i.e. data transfer speed measured in Gpbs) and latency (time to complete a request) are common measures of network performance. The performance impact of running an overlay network on throughput and latency has been examined previously here and here. What we learned from these tests is that Kubernetes networks are generally pretty fast, and servers have no trouble saturating a 1G link, with or without an overlay. It's only when you have 10G networks that you need to start thinking about the overhead of encapsulation. 

This is because during a typical network performance benchmark, there’s no application logic for the host CPU to perform, leaving it available for whatever network processing is required. For this reason we ran our tests in an operating range that did not saturate the link, or the CPU. This has the effect of isolating the impact of processing network policy rules on the host. For these tests we decided to measure latency as measured by the average time required to complete an HTTP request across a range of response sizes. 


Test setup
  • Hardware: Two servers with Intel Core i5-5250U CPUs (2 core, 2 threads per core) running at 1.60GHz, 16GB RAM and 512GB SSD. NIC: Intel Ethernet Connection I218-V (rev 03)
  • Ubuntu 14.04.5
  • Kubernetes 1.3 for data collection (verified samples on v1.4.0-beta.5)
  • Romana v0.9.3.1
  • Client and server load test software
For the tests we had a client pod send 2,000 HTTP requests to a server pod. HTTP requests were sent by the client pod at a rate that ensured that neither the server nor network ever saturated. We also made sure each request started a new TCP session by disabling persistent connections (i.e. HTTP keep-alive). We ran each test with different response sizes and measured the average request duration time (how long does it take to complete a request of that size). Finally, we repeated each set of measurements with different policy configurations. 

Romana detects Kubernetes network policies when they’re created, translates them to Romana’s own policy format, and then applies them on all hosts. Currently, Kubernetes network policies only apply to ingress traffic. This means that outgoing traffic is not affected.
First, we conducted the test without any policies to establish a baseline. We then ran the test again, increasing numbers of policies for the test's network segment. The policies were of the common “allow traffic for a given protocol and port” format. To ensure packets had to traverse all the policies, we created a number of policies that did not match the packet, and finally a policy that would result in acceptance of the packet.

The table below shows the results, measured in milliseconds for different request sizes and numbers of policies:

Response Size
Policies
.5k
1k
10k
100k
1M
0
0.732
0.738
1.077
2.532
10.487
10
0.744
0.742
1.084
2.570
10.556
50
0.745
0.755
1.086
2.580
10.566
100
0.762
0.770
1.104
2.640
10.597
200
0.783
0.783
1.147
2.652
10.677

What we see here is that, as the number of policies increases, processing network policies introduces a very small delay, never more than 0.2ms, even after applying 200 policies. For all practical purposes, no meaningful delay is introduced when network policy is applied. Also worth noting is that doubling the response size from 0.5k to 1.0k had virtually no effect. This is because for very small responses, the fixed overhead of creating a new connection dominates the overall response time (i.e. the same number of packets are transferred).


Note: .5k and 1k lines overlap at ~.8ms in the chart above

Even as a percentage of baseline performance, the impact is still very small. The table below shows that for the smallest response sizes, the worst case delay remains at 7%, or less, up to 200 policies. For the larger response sizes the delay drops to about 1%. 


Response Size
Policies
.5k
1k
10k
100k
1M
0
0.0%
0.0%
0.0%
0.0%
0.0%
10
-1.6%
-0.5%
-0.6%
-1.5%
-0.7%
50
-1.8%
-2.3%
-0.8%
-1.9%
-0.8%
100
-4.1%
-4.3%
-2.5%
-4.3%
-1.0%
200
-7.0%
-6.1%
-6.5%
-4.7%
-1.8%


What is also interesting in these results is that as the number of policies increases, we notice that larger requests experience a smaller relative (i.e. percentage) performance degradation.

This is because when Romana installs iptables rules, it ensures that packets belonging to established connection are evaluated first. The full list of policies only needs to be traversed for the first packets of a connection. After that, the connection is considered ‘established’ and the connection’s state is stored in a fast lookup table. For larger requests, therefore, most packets of the connection are processed with a quick lookup in the ‘established’ table, rather than a full traversal of all rules. This iptables optimization results in performance that is largely independent of the number of network policies. 

Such ‘flow tables’ are common optimizations in network equipment and it seems that iptables uses the same technique quite effectively. 

Its also worth noting that in practise, a reasonably complex application may configure a few dozen rules per segment. It is also true that common network optimization techniques like Websockets and persistent connections will improve the performance of network policies even further (especially for small request sizes), since connections are held open longer and therefore can benefit from the established connection optimization.

These tests were performed using Romana as the backend policy provider and other network policy implementations may yield different results. However, what these tests show is that for almost every application deployment scenario, network policies can be applied using Romana as a network back end without any negative impact on performance.

If you wish to try it for yourself, we invite you to check out Romana. In our GitHub repo you can find an easy to use installer, which works with AWS, Vagrant VMs or any other servers. You can use it to quickly get you started with a Romana powered Kubernetes or OpenStack cluster.


Kubernetes 1.4: Making it easy to run on Kubernetes anywhere

$
0
0
Today we’re happy to announce the release of Kubernetes 1.4.

Since the release to general availability just over 15 months ago, Kubernetes has continued to grow and achieve broad adoption across the industry. From brand new startups to large-scale businesses, users have described how big a difference Kubernetes has made in building, deploying and managing distributed applications. However, one of our top user requests has been making Kubernetes itself easier to install and use. We’ve taken that feedback to heart, and 1.4 has several major improvements.

These setup and usability enhancements are the result of concerted, coordinated work across the community - more than 20 contributors from SIG-Cluster-Lifecycle came together to greatly simplify the Kubernetes user experience, covering improvements to installation, startup, certificate generation, discovery, networking, and application deployment.

Additional product highlights in this release include simplified cluster deployment on any cloud, easy installation of stateful apps, and greatly expanded Cluster Federation capabilities, enabling a straightforward deployment across multiple clusters, and multiple clouds.

What’s new:

Cluster creation with two commands - To get started with Kubernetes a user must provision nodes, install Kubernetes and bootstrap the cluster. A common request from users is to have an easy, portable way to do this on any cloud (public, private, or bare metal).

  • Kubernetes 1.4 introduces ‘kubeadm’ which reduces bootstrapping to two commands, with no complex scripts involved. Once kubernetes is installed, kubeadm init starts the master while kubeadm join joins the nodes to the cluster.
  • Installation is also streamlined by packaging Kubernetes with its dependencies, for most major Linux distributions including Red Hat and Ubuntu Xenial. This means users can now install Kubernetes using familiar tools such as apt-get and yum.
  • Add-on deployments, such as for an overlay network, can be reduced to one command by using a DaemonSet.
  • Enabling this simplicity is a new certificates API and its use for kubelet TLS bootstrap, as well as a new discovery API.

Expanded stateful application support - While cloud-native applications are built to run in containers, many existing applications need additional features to make it easy to adopt containers. Most commonly, these include stateful applications such as batch processing, databases and key-value stores. In Kubernetes 1.4, we have introduced a number of features simplifying the deployment of such applications, including: 

  • ScheduledJob is introduced as Alpha so users can run batch jobs at regular intervals.
  • Init-containers are Beta, addressing the need to run one or more containers before starting the main application, for example to sequence dependencies when starting a database or multi-tier app.
  • Dynamic PVC Provisioning moved to Beta. This feature now enables cluster administrators to expose multiple storage provisioners and allows users to select them using a new Storage Class API object.  
  • Curated and pre-tested Helm charts for common stateful applications such as MariaDB, MySQL and Jenkins will be available for one-command launches using version 2 of the Helm Package Manager.

Cluster federation API additions - One of the most requested capabilities from our global customers has been the ability to build applications with clusters that span regions and clouds. 

  • Federated Replica Sets Beta - replicas can now span some or all clusters enabling cross region or cross cloud replication. The total federated replica count and relative cluster weights / replica counts are continually reconciled by a federated replica-set controller to ensure you have the pods you need in each region / cloud.
  • Federated Services are now Beta, and secrets, events and namespaces have also been added to the federation API.
  • Federated Ingress Alpha - starting with Google Cloud Platform (GCP), users can create a single L7 globally load balanced VIP that spans services deployed across a federation of clusters within GCP. With Federated Ingress in GCP, external clients point to a single IP address and are sent to the closest cluster with usable capacity in any region or zone of the federation in GCP.

Container security support - Administrators of multi-tenant clusters require the ability to provide varying sets of permissions among tenants, infrastructure components, and end users of the system.

  • Pod Security Policy is a new object that enables cluster administrators to control the creation and validation of security contexts for pods/containers. Admins can associate service accounts, groups, and users with a set of constraints to define a security context.
  • AppArmor support is added, enabling admins to run a more secure deployment, and provide better auditing and monitoring of their systems. Users can configure a container to run in an AppArmor profile by setting a single field.

Infrastructure enhancements - We continue adding to the scheduler, storage and client capabilities in Kubernetes based on user and ecosystem needs.

  • Scheduler - introducing inter-pod affinity and anti-affinity Alpha for users who want to customize how Kubernetes co-locates or spreads their pods. Also priority scheduling capability for cluster add-ons such as DNS, Heapster, and the Kube Dashboard.
  • Disruption SLOs - Pod Disruption Budget is introduced to limit impact of pods deleted by cluster management operations (such as node upgrade) at any one time.
  • Storage - New volume plugins for Quobyte and Azure Data Disk have been added.
  • Clients - Swagger 2.0 support is added, enabling non-Go clients.

Kubernetes Dashboard UI - lastly, a great looking Kubernetes Dashboard UI with 90% CLI parity for at-a-glance management.

For a complete list of updates see the release notes on GitHub. Apart from features the most impressive aspect of Kubernetes development is the community of contributors. This is particularly true of the 1.4 release, the full breadth of which will unfold in upcoming weeks.

Availability
Kubernetes 1.4 is available for download at get.k8s.io and via the open source repository hosted on GitHub. To get started with Kubernetes try the Hello World app.

To get involved with the project, join the weekly community meeting or start contributing to the project here (marked help). 

Users and Case Studies
Over the past fifteen months since the Kubernetes 1.0 GA release, the adoption and enthusiasm for this project has surpassed everyone's imagination. Kubernetes runs in production at hundreds of organization and thousands more are in development. Here are a few unique highlights of companies running Kubernetes: 

  • Box -- accelerated their time to delivery from six months to launch a service to less than a week. Read more on how Box runs mission critical production services on Kubernetes.
  • Pearson -- minimized complexity and increased their engineer productivity. Read how Pearson is using Kubernetes to reinvent the world’s largest educational company. 
  • OpenAI -- a non-profit artificial intelligence research company, built infrastructure for deep learning with Kubernetes to maximize productivity for researchers allowing them to focus on the science.

We’re very grateful to our community of over 900 contributors who contributed more than 5,000 commits to make this release possible. To get a closer look on how the community is using Kubernetes, join us at the user conference KubeCon to hear directly from users and contributors.

Connect


Thank you for your support! 

-- Aparna Sinha, Product Manager, Google


How Qbox Saved 50% per Month on AWS Bills Using Kubernetes and Supergiant

$
0
0
Editor’s Note: Today’s post is by the team at Qbox, a hosted Elasticsearch provider sharing their experience with Kubernetes and how it helped save them fifty-percent off their cloud bill. 

A little over a year ago, we at Qbox faced an existential problem. Just about all of the major IaaS providers either launched or acquired services that competed directly with our Hosted Elasticsearch service, and many of them started offering it for free. The race to zero was afoot unless we could re-engineer our infrastructure to be more performant, more stable, and less expensive than the VM approach we had had before, and the one that is in use by our IaaS brethren. With the help of Kubernetes, Docker, and Supergiant (our own hand-rolled layer for managing distributed and stateful data), we were able to deliver 50% savings, a mid-five figure sum. At the same time, support tickets plummeted. We were so pleased with the results that we decided to open source Supergiant as its own standalone product. This post will demonstrate how we accomplished it.

Back in 2013, when not many were even familiar with Elasticsearch, we launched our as-a-service offering with a dedicated, direct VM model. We hand-selected certain instance types optimized for Elasticsearch, and users configured single-tenant, multi-node clusters running on isolated virtual machines in any region. We added a markup on the per-compute-hour price for the DevOps support and monitoring, and all was right with the world for a while as Elasticsearch became the global phenomenon that it is today.

Background
As we grew to thousands of clusters, and many more thousands of nodes, it wasn’t just our AWS bill getting out of hand. We had 4 engineers replacing dead nodes and answering support tickets all hours of the day, every day. What made matters worse was the volume of resources allocated compared to the usage. We had thousands of servers with a collective CPU utilization under 5%. We were spending too much on processors that were doing absolutely nothing. 

How we got there was no great mystery. VM’s are a finite resource, and with a very compute-intensive, burstable application like Elasticsearch, we would be juggling the users that would either undersize their clusters to save money or those that would over-provision and overspend. When the aforementioned competitive pressures forced our hand, we had to re-evaluate everything.

Adopting Docker and Kubernetes
Our team avoided Docker for a while, probably on the vague assumption that the network and disk performance we had with VMs wouldn't be possible with containers. That assumption turned out to be entirely wrong.

To run performance tests, we had to find a system that could manage networked containers and volumes. That's when we discovered Kubernetes. It was alien to us at first, but by the time we had familiarized ourselves and built a performance testing tool, we were sold. It was not just as good as before, it was better.

The performance improvement we observed was due to the number of containers we could “pack” on a single machine. Ironically, we began the Docker experiment wanting to avoid “noisy neighbor,” which we assumed was inevitable when several containers shared the same VM. However, that isolation also acted as a bottleneck, both in performance and cost. To use a real-world example, If a machine has 2 cores and you need 3 cores, you have a problem. It’s rare to come across a public-cloud VM with 3 cores, so the typical solution is to buy 4 cores and not utilize them fully.

This is where Kubernetes really starts to shine. It has the concept of requests and limits, which provides granular control over resource sharing. Multiple containers can share an underlying host VM without the fear of “noisy neighbors”. They can request exclusive control over an amount of RAM, for example, and they can define a limit in anticipation of overflow. It’s practical, performant, and cost-effective multi-tenancy. We were able to deliver the best of both the single-tenant and multi-tenant worlds.

Kubernetes + Supergiant
We built Supergiant originally for our own Elasticsearch customers. Supergiant solves Kubernetes complications by allowing pre-packaged and re-deployable application topologies. In more specific terms, Supergiant lets you use Components, which are somewhat similar to a microservice. Components represent an almost-uniform set of Instances of software (e.g., Elasticsearch, MongoDB, your web application, etc.). They roll up all the various Kubernetes and cloud operations needed to deploy a complex topology into a compact entity that is easy to manage.

For Qbox, we went from needing 1:1 nodes to approximately 1:11 nodes. Sure, the nodes were larger, but the utilization made a substantial difference. As in the picture below, we could cram a whole bunch of little instances onto one big instance and not lose any performance. Smaller users would get the added benefit of higher network throughput by virtue of being on bigger resources, and they would also get greater CPU and RAM bursting.

sg-example.png

Adding Up the Cost Savings
The packing algorithm in Supergiant, with its increased utilization, resulted in an immediate 25% drop in our infrastructure footprint. Remember, this came with better performance and fewer support tickets. We could dial up the packing algorithm and probably save even more money. Meanwhile, because our nodes were larger and far more predictable, we could much more fully leverage the economic goodness that is AWS Reserved Instances. We went with 1-year partial RI’s, which cut the remaining costs by 40%, give or take. Our customers still had the flexibility to spin up, down, and out their Elasticsearch nodes, without forcing us to constantly juggle, combine, split, and recombine our reservations. At the end of the day, we saved 50%. That is $600k per year that can go towards engineering salaries instead of enriching our IaaS provider. 


How we made Kubernetes insanely easy to install

$
0
0

Editor's note: Today’s post is by Luke Marsden, Head of Developer Experience, at Weaveworks, showing the Special Interest Group Cluster-Lifecycle’s recent work on kubeadm, a tool to make installing Kubernetes much simpler.

Over at SIG-cluster-lifecycle, we've been hard at work the last few months on kubeadm, a tool that makes Kubernetes dramatically easier to install. We've heard from users that installing Kubernetes is harder than it should be, and we want folks to be focused on writing great distributed apps not wrangling with infrastructure!

There are three stages in setting up a Kubernetes cluster, and we decided to focus on the second two (to begin with):
  1. Provisioning: getting some machines
  2. Bootstrapping: installing Kubernetes on them and configuring certificates
  3. Add-ons: installing necessary cluster add-ons like DNS and monitoring services, a pod network, etc
We realized early on that there's enormous variety in the way that users want to provision their machines.

They use lots of different cloud providers, private clouds, bare metal, or even Raspberry Pi's, and almost always have their own preferred tools for automating provisioning machines: Terraform or CloudFormation, Chef, Puppet or Ansible, or even PXE booting bare metal. So we made an important decision: kubeadm would not provision machines. Instead, the only assumption it makes is that the user has some computers running Linux.

Another important constraint was we didn't want to just build another tool that "configures Kubernetes from the outside, by poking all the bits into place". There are many external projects out there for doing this, but we wanted to aim higher. We chose to actually improve the Kubernetes core itself to make it easier to install. Luckily, a lot of the groundwork for making this happen had already been started.

We realized that if we made Kubernetes insanely easy to install manually, it should be obvious to users how to automate that process using any tooling.

So, enter kubeadm. It has no infrastructure dependencies, and satisfies the requirements above. It's easy to use and should be easy to automate. It's still in alpha, but it works like this:
  • You install Docker and the official Kubernetes packages for you distribution.
  • Select a master host, run kubeadm init.
  • This sets up the control plane and outputs a kubeadm join [...] command which includes a secure token.
  • On each host selected to be a worker node, run the kubeadm join [...] command from above.
  • Install a pod network. Weave Net is a great place to start here. Install it using just kubectl apply -f https://git.io/weave-kube
Presto! You have a working Kubernetes cluster! Try kubeadm today

For a video walkthrough, check this out:


Follow the kubeadm getting started guide to try it yourself, and please give us feedback on GitHub, mentioning @kubernetes/sig-cluster-lifecycle!

Finally, I want to give a huge shout-out to so many people in the SIG-cluster-lifecycle, without whom this wouldn't have been possible. I'll mention just a few here:

  • Joe Beda kept us focused on keeping things simple for the user.
  • Mike Danese at Google has been an incredible technical lead and always knows what's happening. Mike also tirelessly kept up on the many code reviews necessary.
  • Ilya Dmitrichenko, my colleague at Weaveworks, wrote most of the kubeadm code and also kindly helped other folks contribute.
  • Lucas Käldström from Finland has got to be the youngest contributor in the group and was merging last-minute pull requests on the Sunday night before his school math exam.
  • Brandon Philips and his team at CoreOS led the development of TLS bootstrapping, an essential component which we couldn't have done without.
  • Devan Goodwin from Red Hat built the JWS discovery service that Joe imagined and sorted out our RPMs.
  • Paulo Pires from Portugal jumped in to help out with external etcd support and picked up lots of other bits of work.
  • And many other contributors!

This truly has been an excellent cross-company and cross-timezone achievement, with a lovely bunch of people. There's lots more work to do in SIG-cluster-lifecycle, so if you’re interested in these challenges join our SIG. Looking forward to collaborating with you all!

--Luke Marsden, Head of Developer Experience at Weaveworks

  • Try kubeadm to install Kubernetes today
  • Get involved with the Kubernetes project on GitHub 
  • Post questions (or answer questions) on Stack Overflow 
  • Connect with the community on Slack
  • Follow us on Twitter @Kubernetesio for latest updates


How we improved Kubernetes Dashboard UI in 1.4 for your production needs​

$
0
0
With the release of Kubernetes 1.4 last week, Dashboard – the official web UI for Kubernetes – has a number of exciting updates and improvements of its own. The past three months have been busy ones for the Dashboard team, and we’re excited to share the resulting features of that effort here. If you’re not familiar with Dashboard, the GitHub repo is a great place to get started.

A quick recap before unwrapping our shiny new features: Dashboard was initially released March 2016. One of the focuses for Dashboard throughout its lifetime has been the onboarding experience; it’s a less intimidating way for Kubernetes newcomers to get started, and by showing multiple resources at once, it provides contextualization lacking in kubectl (the CLI). After that initial release though, the product team realized that fine-tuning for a beginner audience was getting ahead of ourselves: there were still fundamental product requirements that Dashboard needed to satisfy in order to have a productive UX to onboard new users too. That became our mission for this release: closing the gap between Dashboard and kubectl by showing more resources, leveraging a web UI’s strengths in monitoring and troubleshooting, and architecting this all in a user friendly way.

Monitoring Graphs
Real time visualization is a strength that UI’s have over CLI’s, and with 1.4 we’re happy to capitalize on that capability with the introduction of real-time CPU and memory usage graphs for all workloads running on your cluster. Even with the numerous third-party solutions for monitoring, Dashboard should include at least some basic out-of-the box functionality in this area. Next up on the roadmap for graphs is extending the timespan the graph represents, adding drill-down capabilities to reveal more details, and improving the UX of correlating data between different graphs.


Logs
Based on user research with Kubernetes’ predecessor Borg and continued community feedback, we know logs are tremendously important to users. For this reason we’re constantly looking for ways to improve these features in Dashboard. This release includes a fix for an issue wherein large numbers of logs would crash the system, as well as the introduction of the ability to view logs by date.

Showing More Resources
The previous release brought all workloads to Dashboard: Pods, Pet Sets, Daemon Sets, Replication Controllers, Replica Set, Services, & Deployments. With 1.4, we expand upon that set of objects by including Services, Ingresses, Persistent Volume Claims, Secrets, & Config Maps. We’ve also introduced an “Admin” section with the Namespace-independent global objects of Namespaces, Nodes, and Persistent Volumes. With the addition of roles, these will be shown only to cluster operators, and developers’ side nav will begin with the Namespace dropdown.

Like glue binding together a loose stack of papers into a book, we needed some way to impose order on these resources for their value to be realized, so one of the features we’re most excited to announce in 1.4 is navigation.

Navigation
In 1.1, all resources were simply stacked on top of each other in a single page. The introduction of a side nav provides quick access to any aspect of your cluster you’d like to check out. Arriving at this solution meant a lot of time put toward thinking about the hierarchy of Kubernetes objects – a difficult task since by design things fit together more like a living organism than a nested set of linear relationships. The solution we’ve arrived at balances the organizational need for grouping and desire to retain a bird’s-eye view of as much relevant information as possible. The design of the side nav is simple and flexible, in order to accommodate more resources in the future. Its top level objects (e.g. “Workloads”, “Services and Discovery”) roll up their child objects and will eventually include aggregated data for said objects.


Closer Alignment with Material Design
Dashboard follows Google’s Material design system, and the implementation of those principles is refined in the new UI: the global create options have been reduced from two choices to one initial “Create” button, the official Kubernetes logo is displayed as an SVG rather than simply as text, and cards were introduced to help better group different types of content (e.g. a table of Replication Controllers and a table of Pods on your “Workloads” page). Material’s guidelines around desktop-focused enterprise-level software are currently limited (and instead focus on a mobile-first context), so we’ve had to improvise with some aspects of the UI and have worked closely with the UX team at Google Cloud Platform to do this – drawing on their expertise in implementing Material in a more information-dense setting.

Sample Use Case
To showcase Dashboard 1.4’s new suite of features and how they’ll make users’ lives better in the real world, let’s imagine the following scenario:

I am a cluster operator and a customer pings me warning that their app, Kubernetes Dashboard, is suffering performance issues. My first step in addressing the issue is to switch to the correct Namespace, kube-system, to examine what could be going on.


Once in the relevant Namespace, I check out my Deployments to see if anything seems awry. Sure enough, I notice a spike in CPU usage.

I realize we need to perform a rolling update to a newer version of that app that can handle the increased requests it’s evidently getting, so I update this Deployment’s image, which in turn creates a new Replica Set.


Now that that Replica Set’s been created, I can open the logs for one of its pods to confirm that it’s been successfully connected to the API server.


Easy as that, we’ve debugged our issue. Dashboard provided us a centralized location to scan for the origin of the problem, and once we had that identified we were able to drill down and address the root of the problem.

Why the Skipped Versions?
If you’ve been following along with Dashboard since 1.0,  you may have been confused by the jump in our versioning; we went 1.0, 1.1...1.4. We did this to synchronize with the main Kubernetes distro, and hopefully going forward this will make that relationship easier to understand.


There’s a Lot More Where That Came From
Dashboard is gaining momentum, and these early stages are a very exciting and rewarding time to be involved. If you’d like to learn more about contributing, check out SIG UI. Chat with us Kubernetes Slack: #sig-ui channel.

--Dan Romlein, UX designer, Apprenda


Dynamic Provisioning and Storage Classes in Kubernetes

$
0
0

Storage is a critical part of running containers, and Kubernetes offers some powerful primitives for managing it. Dynamic volume provisioning, a feature unique to Kubernetes, allows storage volumes to be created on-demand. Without dynamic provisioning, cluster administrators have to manually make calls to their cloud or storage provider to create new storage volumes, and then create PersistentVolume objects to represent them in Kubernetes. The dynamic provisioning feature eliminates the need for cluster administrators to pre-provision storage. Instead, it automatically provisions storage when it is requested by users. This feature was introduced as alpha in Kubernetes 1.2, and has been improved and promoted to beta in the latest release, 1.4. This release makes dynamic provisioning far more flexible and useful.

What’s New?

The alpha version of dynamic provisioning only allowed a single, hard-coded provisioner to be used in a cluster at once. This meant that when Kubernetes determined storage needed to be dynamically provisioned, it always used the same volume plugin to do provisioning, even if multiple storage systems were available on the cluster. The provisioner to use was inferred based on the cloud environment - EBS for AWS, Persistent Disk for Google Cloud, Cinder for OpenStack, and vSphere Volumes on vSphere. Furthermore, the parameters used to provision new storage volumes were fixed: only the storage size was configurable. This meant that all dynamically provisioned volumes would be identical, except for their storage size, even if the storage system exposed other parameters (such as disk type) for configuration during provisioning.

Although the alpha version of the feature was limited in utility, it allowed us to “get some miles” on the idea, and helped determine the direction we wanted to take.

The beta version of dynamic provisioning, new in Kubernetes 1.4, introduces a new API object, StorageClass. Multiple StorageClass objects can be defined each specifying a volume plugin (aka provisioner) to use to provision a volume and the set of parameters to pass to that provisioner when provisioning. This design allows cluster administrators to define and expose multiple flavors of storage (from the same or different storage systems) within a cluster, each with a custom set of parameters. This design also ensures that end users don’t have to worry about the the complexity and nuances of how storage is provisioned, but still have the ability to select from multiple storage options.

How Do I use It?

Below is an example of how a cluster administrator would expose two tiers of storage, and how a user would select and use one. For more details, see the reference and example docs.

Admin Configuration

The cluster admin defines and deploys two StorageClass objects to the Kubernetes cluster:

kind: StorageClass
apiVersion: extensions/v1beta1
metadata:
 name: slow
provisioner: kubernetes.io/gce-pd
parameters:
 type: pd-standard

This creates a storage class called “slow” which will provision standard disk-like Persistent Disks.

kind: StorageClass
apiVersion: extensions/v1beta1
metadata:
 name: fast
provisioner: kubernetes.io/gce-pd
parameters:
 type: pd-ssd


This creates a storage class called “fast” which will provision SSD-like Persistent Disks.

User Request

Users request dynamically provisioned storage by including a storage class in their PersistentVolumeClaim. For the beta version of this feature, this is done via the volume.beta.kubernetes.io/storage-class annotation. The value of this annotation must match the name of a StorageClass configured by the administrator.

To select the “fast” storage class, for example, a user would create the following PersistentVolumeClaim:

{
 "kind": "PersistentVolumeClaim",
 "apiVersion": "v1",
 "metadata": {
   "name": "claim1",
   "annotations": {
       "volume.beta.kubernetes.io/storage-class": "fast"
   }
 },
 "spec": {
   "accessModes": [
     "ReadWriteOnce"
   ],
   "resources": {
     "requests": {
       "storage": "30Gi"
     }
   }
 }
}


This claim will result in an SSD-like Persistent Disk being automatically provisioned. When the claim is deleted, the volume will be destroyed.

Defaulting Behavior

Dynamic Provisioning can be enabled for a cluster such that all claims are dynamically provisioned without a storage class annotation. This behavior is enabled by the cluster administrator by marking one StorageClass object as “default”. A StorageClass can be marked as default by adding the storageclass.beta.kubernetes.io/is-default-class annotation to it.

When a default StorageClass exists and a user creates a PersistentVolumeClaim without a storage-class annotation, the new DefaultStorageClass admission controller (also introduced in v1.4), automatically adds the class annotation pointing to the default storage class.

Can I Still Use the Alpha Version?

Kubernetes 1.4 maintains backwards compatibility with the alpha version of the dynamic provisioning feature to allow for a smoother transition to the beta version. The alpha behavior is triggered by the existance of the alpha dynamic provisioning annotation (volume.alpha.kubernetes.io/storage-class). Keep in mind that if the beta annotation (volume.beta.kubernetes.io/storage-class) is present, it takes precedence, and triggers the beta behavior.

Support for the alpha version is deprecated and will be removed in a future release.

What’s Next?

Dynamic Provisioning and Storage Classes will continue to evolve and be refined in future releases. Below are some areas under consideration for further development.

Standard Cloud Provisioners
For deployment of Kubernetes to cloud providers, we are considering automatically creating a provisioner for the cloud’s native storage system. This means that a standard deployment on AWS would result in a StorageClass that provisions EBS volumes, a standard deployment on Google Cloud would result in a StorageClass that provisions GCE PDs. It is also being debated whether these provisioners should be marked as default, which would make dynamic provisioning the default behavior (no annotation required).

Out-of-Tree Provisioners
There has been ongoing discussion about whether Kubernetes storage plugins should live “in-tree” or “out-of-tree”. While the details for how to implement out-of-tree plugins is still in the air, there is a proposal introducing a standardized way to implement out-of-tree dynamic provisioners.

How Do I Get Involved?

If you’re interested in getting involved with the design and development of Kubernetes Storage, join the Kubernetes Storage Special-Interest-Group (SIG). We’re rapidly growing and always welcome new contributors.

-- Saad Ali, Software Engineer, Google


Helm Charts: making it simple to package and deploy common applications on Kubernetes

$
0
0
There are thousands of people and companies packaging their applications for deployment on Kubernetes. This usually involves crafting a few different Kubernetes resource definitions that configure the application runtime, as well as defining the mechanism that users and other apps leverage to communicate with the application. There are some very common applications that users regularly look for guidance on deploying, such as databases, CI tools, and content management systems. These types of applications are usually not ones that are developed and iterated on by end users, but rather their configuration is customized to fit a specific use case. Once that application is deployed users can link it to their existing systems or leverage their functionality to solve their pain points.

For best practices on how these applications should be configured, users could look at the many resources available such as: the examples folder in the Kubernetes repository, the Kubernetes contrib repository, the Helm Charts repository, and the Bitnami Charts repository. While these different locations provided guidance, it was not always formalized or consistent such that users could leverage similar installation procedures across different applications.

So what do you do when there are too many places for things to be found?


In this case, we’re not creating Yet Another Place for Applications, rather promoting an existing one as the canonical location. As part of the Special Interest Group Apps (SIG Apps) work for the Kubernetes 1.4 release, we began to provide a home for these Kubernetes deployable applications that provides continuous releases of well documented and user friendly packages. These packages are being created as Helm Charts and can be installed using the Helm tool. Helm allows users to easily templatize their Kubernetes manifests and provide a set of configuration parameters that allows users to customize their deployment. 

Helm is the package manager (analogous to yum and apt) and Charts are packages (analogous to debs and rpms). The home for these Charts is the Kubernetes Charts repository which provides continuous integration for pull requests, as well as automated releases of Charts in the master branch. 

There are two main folders where charts reside. The stable folder hosts those applications which meet minimum requirements such as proper documentation and inclusion of only Beta or higher Kubernetes resources. The incubator folder provides a place for charts to be submitted and iterated on until they’re ready for promotion to stable at which time they will automatically be pushed out to the default repository. For more information on the repository structure and requirements for being in stable, have a look at this section in the README.

The following applications are now available:


Example workflow for a Chart developer

  1. Create a chart
  2. Developer provides parameters via the values.yaml file allowing users to customize their deployment. This can be seen as the API between chart devs and chart users.
  3. A README is written to help describe the application and its parameterized values.
  4. Once the application installs properly and the values customize the deployment appropriately, the developer adds a NOTES.txt file that is shown as soon as the user installs. This file generally points out the next steps for the user to connect to or use the application.
  5. If the application requires persistent storage, the developer adds a mechanism to store the data such that pod restarts do not lose data. Most charts requiring this today are using dynamic volume provisioning to abstract away underlying storage details from the user which allows a single configuration to work against Kubernetes installations.
  6. Submit a Pull Request to the Kubernetes Charts repo. Once tested and reviewed, the PR will be merged.
  7. Once merged to the master branch, the chart will be packaged and released to Helm’s default repository and available for users to install. 

Example workflow for a Chart user

  1. Install Helm
  2. Initialize Helm
  3. Search for a chart 
    $ helm search
    NAME VERSION DESCRIPTION stable/drupal 0.3.1 One of the most versatile open source content m...stable/jenkins 0.1.0 A Jenkins Helm chart for Kubernetes. stable/mariadb 0.4.0 Chart for MariaDB stable/mysql 0.1.0 Chart for MySQL stable/redmine 0.3.1 A flexible project management web application. stable/wordpress 0.3.0 Web publishing platform for building blogs and ...
  4. Install the chart
    $ helm install stable/jenkins
  5. After the install 
    Notes:


    1. Get your 'admin' user password by running:
     printf $(printf '\%o' `kubectl get secret --namespace default brawny-frog-jenkins -o jsonpath="{.data.jenkins-admin-password[*]}"`);echo


    2. Get the Jenkins URL to visit by running these commands in the same shell:
    **** NOTE: It may take a few minutes for the LoadBalancer IP to be available.                      ****
    ****       You can watch the status of by running 'kubectl get svc -w brawny-frog-jenkins' ****
     export SERVICE_IP=$(kubectl get svc --namespace default brawny-frog-jenkins -o jsonpath='{.status.loadBalancer.ingress[0].ip}')
     echo http://$SERVICE_IP:8080/login


    3. Login with the password from step 1 and the username: admin


    For more information on running Jenkins on Kubernetes, visit here.

Conclusion

Now that you’ve seen workflows for both developers and users, we hope that you’ll join us in consolidating the breadth of application deployment knowledge into a more centralized place. Together we can raise the quality bar for both developers and users of Kubernetes applications. We’re always looking for feedback on how we can better our process. Additionally, we’re looking for contributions of new charts or updates to existing ones. Join us in the following places to get engaged:

A big thank you to the folks at Bitnami, Deis, Google and the other contributors who have helped get the Charts repository to where it is today. We still have a lot of work to do but it's been wonderful working together as a community to move this effort forward.

--Vic Iglesias, Cloud Solutions Architect, Google

Building Globally Distributed Services using Kubernetes Cluster Federation

$
0
0
Editor's note: Today’s post is by Allan Naim, Product Manager, and Quinton Hoole, Staff Engineer at Google, showing how to deploy a multi-homed service behind a global load balancer and have requests sent to the closest cluster.

In Kubernetes 1.3, we announced Kubernetes Cluster Federation and introduced the concept of Cross Cluster Service Discovery, enabling developers to deploy a service that was sharded across a federation of clusters spanning different zones, regions or cloud providers. This enables developers to achieve higher availability for their applications, without sacrificing quality of service, as detailed in our previous blog post. 

In the latest release, Kubernetes 1.4, we've extended Cluster Federation to support Replica Sets, Secrets, Namespaces and Ingress objects. This means that you no longer need to deploy and manage these objects individually in each of your federated clusters. Just create them once in the federation, and have its built-in controllers automatically handle that for you.

Federated Replica Sets leverage the same configuration as non-federated Kubernetes Replica Sets and automatically distribute Pods across one or more federated clusters. By default, replicas are evenly distributed across all clusters, but for cases where that is not the desired behavior, we've introduced Replica Set preferences, which allow replicas to be distributed across only some clusters, or in non-equal proportions (define annotations). 

Starting with Google Cloud Platform (GCP), we’ve introduced Federated Ingress as a Kubernetes 1.4 alpha feature which enables external clients point to a single IP address and have requests sent to the closest cluster with usable capacity in any region, zone of the Federation. 

Federated Secrets automatically create and manage secrets across all clusters in a Federation, automatically ensuring that these are kept globally consistent and up-to-date, even if some clusters are offline when the original updates are applied.

Federated Namespaces are similar to the traditional Kubernetes Namespaces providing the same functionality. Creating them in the Federation control plane ensures that they are synchronized across all the clusters in Federation.

Federated Events are similar to the traditional Kubernetes Events providing the same functionality. Federation Events are stored only in Federation control plane and are not passed on to the underlying kubernetes clusters.

Let’s walk through how all this stuff works. We’re going to provision 3 clusters per region, spanning 3 continents (Europe, North America and Asia). 


The next step is to federate these clusters. Kelsey Hightower developed a tutorial for setting up a Kubernetes Cluster Federation. Follow the tutorial to configure a Cluster Federation with clusters in 3 zones in each of the 3 GCP regions, us-central1, europe-west1 and asia-east1. For the purpose of this blog post, we’ll provision the Federation Control Plane in the us-central1-b zone. Note that more highly available, multi-cluster deployments are also available, but not used here in the interests of simplicity.

The rest of the blog post assumes that you have a running Kubernetes Cluster Federation provisioned. 

Let’s verify that we have 9 clusters in 3 regions running.

$ kubectl --context=federation-cluster get clusters

NAME              STATUS    AGE
gce-asia-east1-a     Ready     17m
gce-asia-east1-b     Ready     15m
gce-asia-east1-c     Ready     10m
gce-europe-west1-b   Ready     7m
gce-europe-west1-c   Ready     7m
gce-europe-west1-d   Ready     4m
gce-us-central1-a    Ready     1m
gce-us-central1-b    Ready     53s
gce-us-central1-c    Ready     39s

You can download the source used in this blog post here. The source consists of the following files:

  • configmaps/zonefetch.yaml - retrieves the zone from the instance metadata server and concatenates into volume mount path
  • replicasets/nginx-rs.yaml - deploys a Pod consisting of an nginx and busybox container
  • ingress/ingress.yaml - creates a load balancer with a global VIP  that distributes requests to the closest nginx backend
  • services/nginx.yaml - exposes the nginx backend as an external service

In our example, we’ll be deploying the service and ingress object using the federated control plane. The ConfigMap object isn’t currently supported by Federation, so we’ll be deploying it manually in each of the underlying Federation clusters. Our cluster deployment will look as follows:

We’re going to deploy a Service that is sharded across our 9 clusters. The backend deployment will consist of a Pod with 2 containers:
  • busybox container that fetches the zone and outputs an HTML with the zone embedded in it into a Pod volume mount path
  • nginx container that reads from that Pod volume mount path and serves an HTML containing the zone it’s running in

Let’s start by creating a federated service object in the federation-cluster context.

$ kubectl --context=federation-cluster create -f services/nginx.yaml

It will take a few minutes for the service to propagate across the 9 clusters. 


$ kubectl --context=federation-cluster describe services nginx

Name:                   nginx
Namespace:              default
Labels:                 app=nginx
Selector:               app=nginx
Type:                   LoadBalancer
IP:
LoadBalancer Ingress:   108.59.xx.xxx, 104.199.xxx.xxx, ...
Port:                   http    80/TCP
NodePort:               http    30061/TCP
Endpoints:              <none>
Session Affinity:       None

Let’s now create a Federated Ingress. Federated Ingresses are created in much that same way as traditional Kubernetes Ingresses: by making an API call which specifies the desired properties of your logical ingress point. In the case of Federated Ingress, this API call is directed to the Federation API endpoint, rather than a Kubernetes cluster API endpoint. The API for Federated Ingress is 100% compatible with the API for traditional Kubernetes Services.


$ cat ingress/ingress.yaml
apiVersion: extensions/v1beta1
kind: Ingress
metadata:
 name: nginx
spec:
 backend:
   serviceName: nginx
   servicePort: 80


$ kubectl --context=federation-cluster create -f ingress/ingress.yaml
ingress "nginx" created

Once created, the Federated Ingress controller automatically:
  1. creates matching Kubernetes Ingress objects in every cluster underlying your Cluster Federation
  2. ensures that all of these in-cluster ingress objects share the same logical global L7 (i.e. HTTP(S)) load balancer and IP address
  3. monitors the health and capacity of the service “shards” (i.e. your Pods) behind this ingress in each cluster
  4. ensures that all client connections are routed to an appropriate healthy backend service endpoint at all times, even in the event of Pod, cluster, availability zone or regional outages
We can verify the ingress objects are matching in the underlying clusters. Notice the ingress IP addresses for all 9 clusters is the same.


$ for c in $(kubectl config view -o jsonpath='{.contexts[*].name}'); do kubectl --context=$c get ingress; done
NAME      HOSTS     ADDRESS   PORTS     AGE
nginx     *                   80        1h
NAME      HOSTS     ADDRESS          PORTS     AGE
nginx     *         130.211.40.xxx   80        40m
NAME      HOSTS     ADDRESS          PORTS     AGE
nginx     *         130.211.40.xxx   80        1h
NAME      HOSTS     ADDRESS          PORTS     AGE
nginx     *         130.211.40.xxx   80        26m
NAME      HOSTS     ADDRESS          PORTS     AGE
nginx     *         130.211.40.xxx   80        1h
NAME      HOSTS     ADDRESS          PORTS     AGE
nginx     *         130.211.40.xxx   80        25m
NAME      HOSTS     ADDRESS          PORTS     AGE
nginx     *         130.211.40.xxx   80        38m
NAME      HOSTS     ADDRESS          PORTS     AGE
nginx     *         130.211.40.xxx   80        3m
NAME      HOSTS     ADDRESS          PORTS     AGE
nginx     *         130.211.40.xxx   80        57m
NAME      HOSTS     ADDRESS          PORTS     AGE
nginx     *         130.211.40.xxx   80        56m

Note that in the case of Google Cloud Platform, the logical L7 load balancer is not a single physical device (which would present both a single point of failure, and a single global network routing choke point), but rather a truly global, highly available load balancing managed service, globally reachable via a single, static IP address.

Clients inside your federated Kubernetes clusters (i.e. Pods) will be automatically routed to the cluster-local shard of the Federated Service backing the Ingress in their cluster if it exists and is healthy, or the closest healthy shard in a different cluster if it does not. Note that this involves a network trip to the HTTP(S) load balancer, which resides outside your local Kubernetes cluster but inside the same GCP region.

The next step is to schedule the service backends. Let’s first create the ConfigMap in each cluster in the Federation. 

We do this by submitting the ConfigMap to each cluster in the Federation.


$ for c in $(kubectl config view -o jsonpath='{.contexts[*].name}'); do kubectl --context=$c create -f configmaps/zonefetch.yaml; done

Let’s have a quick peek at our Replica Set:


$ cat replicasets/nginx-rs.yaml

apiVersion: extensions/v1beta1
kind: ReplicaSet
metadata:
 name: nginx
 labels:
   app: nginx
   type: demo
spec:
 replicas: 9
 template:
   metadata:
     labels:
       app: nginx
   spec:
     containers:
     - image: nginx
       name: frontend
       ports:
         - containerPort: 80
       volumeMounts:
       - name: html-dir
         mountPath: /usr/share/nginx/html
     - image: busybox
       name: zone-fetcher
       command:
         - "/bin/sh"
         - "-c"
         - "/zonefetch/zonefetch.sh"
       volumeMounts:
       - name: zone-fetch
         mountPath: /zonefetch
       - name: html-dir
         mountPath: /usr/share/nginx/html
     volumes:
       - name: zone-fetch
         configMap:
           defaultMode: 0777
           name: zone-fetch
       - name: html-dir
         emptyDir:
           medium: ""

The Replica Set consists of 9 replicas, spread evenly across 9 clusters within the Cluster Federation. Annotations can also be used to control which clusters Pods are scheduled to. This is accomplished by adding annotations to the Replica Set spec, as follows:


apiVersion: extensions/v1beta1
kind: ReplicaSet
metadata:
 name: nginx-us
 annotations:
   federation.kubernetes.io/replica-set-preferences: |
       {
           "rebalance": true,
           "clusters": {
               "gce-us-central1-a": {
                   "minReplicas": 2,
                   "maxReplicas": 4,
                   "weight": 1
               },
               "gce-us-central10b": {
                   "minReplicas": 2,
                   "maxReplicas": 4,
                   "weight": 1
               }
           }
       }

For the purpose of our demo, we’ll keep things simple and spread our Pods evenly across the Cluster Federation.

Let’s create the federated Replica Set:


$ kubectl --context=federation-cluster create -f replicasets/nginx-rs.yaml

Verify the Replica Sets and Pods were created in each cluster:


$ for c in $(kubectl config view -o jsonpath='{.contexts[*].name}'); do kubectl --context=$c get rs; done
NAME      DESIRED   CURRENT   READY     AGE
nginx     1         1         1         42s
NAME      DESIRED   CURRENT   READY     AGE
nginx     1         1         1         14m
NAME      DESIRED   CURRENT   READY     AGE
nginx     1         1         1         45s
NAME      DESIRED   CURRENT   READY     AGE
nginx     1         1         1         46s
NAME      DESIRED   CURRENT   READY     AGE
nginx     1         1         1         47s
NAME      DESIRED   CURRENT   READY     AGE
nginx     1         1         1         48s
NAME      DESIRED   CURRENT   READY     AGE
nginx     1         1         1         49s
NAME      DESIRED   CURRENT   READY     AGE
nginx     1         1         1         49s
NAME      DESIRED   CURRENT   READY     AGE
nginx     1         1         1         49s

$ for c in $(kubectl config view -o jsonpath='{.contexts[*].name}'); do kubectl --context=$c get po; done
NAME          READY     STATUS    RESTARTS   AGE
nginx-ph8zx   2/2       Running   0          25s
NAME          READY     STATUS    RESTARTS   AGE
nginx-sbi5b   2/2       Running   0          27s
NAME          READY     STATUS    RESTARTS   AGE
nginx-pf2dr   2/2       Running   0          28s
NAME          READY     STATUS    RESTARTS   AGE
nginx-imymt   2/2       Running   0          30s
NAME          READY     STATUS    RESTARTS   AGE
nginx-9cd5m   2/2       Running   0          31s
NAME          READY     STATUS    RESTARTS   AGE
nginx-vxlx4   2/2       Running   0          33s
NAME          READY     STATUS    RESTARTS   AGE
nginx-itagl   2/2       Running   0          33s
NAME          READY     STATUS    RESTARTS   AGE
nginx-u7uyn   2/2       Running   0          33s
NAME          READY     STATUS    RESTARTS   AGE
nginx-i0jh6   2/2       Running   0          34s

Below is an illustration of how the nginx service and associated ingress deployed. To summarize, we have a global VIP (130.211.23.176) exposed using a Global L7 load balancer that forwards requests to the closest cluster with available capacity.

To test this out, we’re going to spin up 2 Google Cloud Engine (GCE) instances, one in us-west1-b and the other in asia-east1-a. All client requests are automatically routed, via the shortest network path, to a healthy Pod in the closest cluster to the origin of the request. So for example, HTTP(S) requests from Asia will be routed directly to the closest cluster in Asia that has available capacity. If there are no such clusters in Asia, the request will be routed to the next closest cluster (in this case the U.S.). This works irrespective of whether the requests originate from a GCE instance or anywhere else on the internet. We only use a GCE instance for simplicity in the demo.


We can SSH directly into the VMs using the Cloud Console or by issuing a gcloud SSH command. 


$ gcloud compute ssh test-instance-asia --zone asia-east1-a
-----
user@test-instance-asia:~$ curl 130.211.40.186
<!DOCTYPE html>
<html>
<head>
<title>Welcome to the global site!</title>
</head>
<body>
<h1>Welcome to the global site! You are being served from asia-east1-b</h1>
<p>Congratulations!</p>

user@test-instance-asia:~$ exit
----

$ gcloud compute ssh test-instance-us --zone us-west1-b
----
user@test-instance-us:~$ curl 130.211.40.186
<!DOCTYPE html>
<html>
<head>
<title>Welcome to the global site!</title>
</head>
<body>
<h1>Welcome to the global site! You are being served from us-central1-b</h1>
<p>Congratulations!</p>

----

Federations of Kubernetes Clusters can include clusters running in different cloud providers (e.g. GCP, AWS), and on-premises (e.g. on OpenStack). However, in Kubernetes 1.4, Federated Ingress is only supported across Google Cloud Platform clusters. In future versions we intend to support hybrid cloud Ingress-based deployments.

To summarize, we walked through leveraging the Kubernetes 1.4 Federated Ingress alpha feature to deploy a multi-homed service behind a global load balancer. External clients point to a single IP address and are sent to the closest cluster with usable capacity in any region, zone of the Federation, providing higher levels of availability without sacrificing latency or ease of operation.

We'd love to hear feedback on Kubernetes Cross Cluster Services. To join the community:


How We Architected and Run Kubernetes on OpenStack at Scale at Yahoo! JAPAN

$
0
0

Editor’s note: today’s post is by the Infrastructure Engineering team at Yahoo! JAPAN, talking about how they run OpenStack on Kubernetes. This post has been translated and edited for context with permission -- originally published on the Yahoo! JAPAN engineering blog


Intro
This post outlines how Yahoo! JAPAN, with help from Google and Solinea, built an automation tool chain for “one-click” code deployment to Kubernetes running on OpenStack. 

We’ll also cover the basic security, networking, storage, and performance needs to ensure production readiness. 

Finally, we will discuss the ecosystem tools used to build the CI/CD pipeline, Kubernetes as a deployment platform on VMs/bare metal, and an overview of Kubernetes architecture to help you architect and deploy your own clusters. 

Preface
Since our company started using OpenStack in 2012, our internal environment has changed quickly. Our initial goal of virtualizing hardware was achieved with OpenStack. However, due to the progress of cloud and container technology, we needed the capability to launch services on various platforms. This post will provide our example of taking applications running on OpenStack and porting them to Kubernetes.

Coding Lifecycle
The goal of this project is to create images for all required platforms from one application code, and deploy those images onto each platform. For example, when code is changed at the code registry, bare metal images, Docker containers and VM images are created by CI (continuous integration) tools, pushed into our image registry, then deployed to each infrastructure platform.


We use following products in our CICD pipeline:


Function
Product
Code registry
GitHub Enterprise
CI tools
Jenkins
Image registry
Artifactory
Bug tracking system
JIRA
deploying Bare metal platform
OpenStack Ironic
deploying VM platform
OpenStack
deploying container platform
Kubernetes

Image Creation. Each image creation workflow is shown in the next diagram.

VM Image Creation:


  1. push code to GitHub
  2. hook to Jenkins master
  3. Launch job at Jenkins slave 
  4. checkout Packer repository
  5. Run Service Job
  6. Execute Packer by build script
  7. Packer start VM for OpenStack Glance 
  8. Configure VM and install required applications
  9. create snapshot and register to glance
  10. Download the new created image from Glance
  11. Upload the image to Artifactory
Bare Metal Image Creation:

  1. push code to GitHub
  2. hook to Jenkins master
  3. Launch job at Jenkins slave 
  4. checkout Packer repository
  5. Run Service Job
  6. Download base bare metal image by build script
  7. build script execute diskimage-builder with Packer to create bare metal image
  8. Upload new created image to Glance
  9. Upload the image to Artifactory
Container Image Creation:

  1. push code to GitHub
  2. hook to Jenkins master
  3. Launch job at Jenkins slave 
  4. checkout Dockerfile repository
  5. Run Service Job
  6. Download base docker image from Artifactory
  7. If no docker image found at Artifactory, download from Docker Hub
  8. Execute docker build and create image 
  9. Upload the image to Artifactory
Platform Architecture.

Let’s focus on the container workflow to walk through how we use Kubernetes as a deployment platform. This platform architecture is as below.


Function
Product
Infrastructure Services
OpenStack
Container Host
CentOS
Container Cluster Manager
Kubernetes
Container Networking
Project Calico
Container Engine
Docker
Container Registry
Artifactory
Service Registry
etcd
Source Code Management
GitHub Enterprise
CI tool
Jenkins
Infrastructure Provisioning
Terraform
Logging
Fluentd, Elasticsearch, Kibana
Metrics
Heapster, Influxdb, Grafana
Service Monitoring
Prometheus

We use CentOS for Container Host (OpenStack instances) and install Docker, Kubernetes, Calico, etcd and so on. Of course, it is possible to run various container applications on Kubernetes. In fact, we run OpenStack as one of those applications. That's right, OpenStack on Kubernetes on OpenStack. We currently have more than 30 OpenStack clusters, that quickly become hard to manage and operate. As such, we wanted to create a simple, base OpenStack cluster to provide the basic functionality needed for Kubernetes and make our OpenStack environment easier to manage.

Kubernetes Architecture

Let me explain Kubernetes architecture in some more detail. The architecture diagram is below.


Product
Description
OpenStack Keystone
Kubernetes Authentication and Authorization
OpenStack Cinder
External volume used from Pod (grouping of multiple containers)
kube-apiserver
Configure and validate objects like Pod or Services (definition of access to services in container) through REST API
kube-scheduler
Allocate Pods to each node
kube-controller-manager
Execute Status management, manage replication controller
kubelet
Run on each node as agent and manage Pod
calico
Enable inter-Pod connection using BGP
kube-proxy
Configure iptable NAT tables to configure IP and load balance (ClusterIP)
etcd
Distribute KVS to store Kubernetes and Calico information
etcd-proxy
Run on each node and transfer client request to etcd clusters
Tenant Isolation To enable multi-tenant usage like OpenStack, we utilize OpenStack Keystone for authentication and authorization.

Authentication With a Kubernetes plugin, OpenStack Keystone can be used for Authentication. By Adding authURL of Keystone at startup Kubernetes API server, we can use OpenStack OS_USERNAME and OS_PASSWORD for Authentication. AuthorizationWe currently use the ABAC (Attribute-Based Access Control) mode of Kubernetes Authorization. We worked with a consulting company, Solinea, who helped create a utility to convert OpenStack Keystone user and tenant information to Kubernetes JSON policy file that maps Kubernetes ABAC user and namespace information to OpenStack tenants. We then specify that policy file when launching Kubernetes API Server. This utility also creates namespaces from tenant information. These configurations enable Kubernetes to authenticate with OpenStack Keystone and operate in authorized namespaces. Volumes and Data Persistence Kubernetes provides “Persistent Volumes” subsystem which works as persistent storage for Pods. “Persistent Volumes” is capable to support cloud-provider storage, it is possible to utilize OpenStack cinder-volume by using OpenStack as cloud provider. NetworkingFlannel and various networking exists as networking model for Kubernetes, we used Project Calico for this project. Yahoo! JAPAN recommends to build data center with pure L3 networking like redistribute ARP validation or IP CLOS networking, Project Calico matches this direction. When we apply overlay model like Flannel, we cannot access to Pod IP from outside of Kubernetes clusters. But Project Calico makes it possible. We also use Project Calico for Load Balancing we describe later.

In Project Calico, broadcast production IP by BGP working on BIRD containers (OSS routing software) launched on each nodes of Kubernetes. By default, it broadcast in cluster only. By setting peering routers outside of clusters, it makes it possible to access a Pod from outside of the clusters. External Service Load Balancing
There are multiple choices of external service load balancers (access to services from outside of clusters) for Kubernetes such as NodePort, LoadBalancer and Ingress. We could not find solution which exactly matches our requirements. However, we found a solution that almost matches our requirements by broadcasting Cluster IP used for Internal Service Load Balancing (access to services from inside of clusters) with Project Calico BGP which enable External Load Balancing at Layer 4 from outside of clusters.

Service Discovery
Service Discovery is possible at Kubernetes by using SkyDNS addon. This is provided as cluster internal service, it is accessible in cluster like ClusterIP. By broadcasting ClusterIP by BGP, name resolution works from outside of clusters. By combination of Image creation workflow and Kubernetes, we built the following tool chain which makes it easy from code push to deployment.
Summary
In summary, by combining Image creation workflows and Kubernetes, Yahoo! JAPAN, with help from Google and Solinea, successfully built an automated tool chain which makes it easy to go from code push to deployment, while taking multi-tenancy, authn/authz, storage, networking, service discovery and other necessary factors for production deployment. We hope you found the discussion of ecosystem tools used to build the CI/CD pipeline, Kubernetes as a deployment platform on VMs/bare-metal, and the overview of Kubernetes architecture to help you architect and deploy your own clusters. Thank you to all of the people who helped with this project. --Norifumi Matsuya, Hirotaka Ichikawa, Masaharu Miyamoto and Yuta Kinoshita. This post has been translated and edited for context with permission -- originally published on the Yahoo! JAPAN engineer blog where this was one in a series of posts focused on Kubernetes.

Tail Kubernetes with Stern

$
0
0
Editor’s note: today’s post is by Antti Kupila, Software Engineer, at Wercker, about building a tool to tail multiple pods and containers on Kubernetes.

We love Kubernetes here at Wercker and build all our infrastructure on top of it. When deploying anything you need to have good visibility to what's going on and logs are a first view into the inner workings of your application. Good old tail -f has been around for a long time and Kubernetes has this too, built right into kubectl.

I should say that tail is by no means the tool to use for debugging issues but instead you should feed the logs into a more persistent place, such as Elasticsearch. However, there's still a place for tail where you need to quickly debug something or perhaps you don't have persistent logging set up yet (such as when developing an app in Minikube).

Multiple Pods

Kubernetes has the concept of Replication Controllers which ensure that n pods are running at the same time. This allows rolling updates and redundancy. Considering they're quite easy to set up there's really no reason not to do so.

However now there are multiple pods running and they all have a unique id. One issue here is that you'll need to know the exact pod id (kubectl get pods) but that changes every time a pod is created so you'll need to do this every time. Another consideration is the fact that Kubernetes load balances the traffic so you won't know at which pod the request ends up at. If you're tailing pod A but the traffic ends up at pod B you'll miss what happened.

Let's say we have a pod called service with 3 replicas. Here's what that would look like:

$ kubectl get pods                         # get pods to find pod ids
$ kubectl log -f service-1786497219-2rbt1  # pod 1
$ kubectl log -f service-1786497219-8kfbp  # pod 2
$ kubectl log -f service-1786497219-lttxd  # pod 3

Multiple containers

We're heavy users gRPC for internal services and expose the gRPC endpoints over REST using gRPC Gateway. Typically we have server and gateway living as two containers in the same pod (same binary that sets the mode by a cli flag). The gateway talks to the server in the same pod and both ports are exposed to Kubernetes. For internal services we can talk directly to the gRPC endpoint while our website communicates using standard REST to the gateway.

This poses a problem though; not only do we now have multiple pods but we also have multiple containers within the pod. When this is the case the built-in logging of kubectl requires you to specify which containers you want logs from.

If we have 3 replicas of a pod and 2 containers in the pod you'll need 6 kubectl log -f <pod id> <container id>. We work with big monitors but this quickly gets out of hand…
If our service pod has a server and gateway container we'd be looking at something like this:

$ kubectl get pods                                 # get pods to find pod ids
$ kubectl describe pod service-1786497219-2rbt1    # get containers in pod
$ kubectl log -f service-1786497219-2rbt1 server   # pod 1
$ kubectl log -f service-1786497219-2rbt1 gateway  # pod 1
$ kubectl log -f service-1786497219-8kfbp server   # pod 2
$ kubectl log -f service-1786497219-8kfbp gateway  # pod 2
$ kubectl log -f service-1786497219-lttxd server   # pod 3
$ kubectl log -f service-1786497219-lttxd gateway  # pod 3

Stern

To get around this we built Stern. It's a super simple utility that allows you to specify both the pod id and the container id as regular expressions. Any match will be followed and the output is multiplexed together, prefixed with the pod and container id, and color-coded for human consumption (colors are stripped if piping to a file).

Here's how the service example would look:

$ stern service
This will match any pod containing the word service and listen to all containers within it. If you only want to see traffic to the server container you could do stern --container server service and it'll stream the logs of all the server containers from the 3 pods.
The output would look something like this:
$ stern service
+ service-1786497219-2rbt1 › server
+ service-1786497219-2rbt1 › gateway
+ service-1786497219-8kfbp › server
+ service-1786497219-8kfbp › gateway
+ service-1786497219-lttxd › server
+ service-1786497219-lttxd › gateway
service-1786497219-8kfbp server Log message from server
service-1786497219-2rbt1 gateway Log message from gateway
service-1786497219-8kfbp gateway Log message from gateway
service-1786497219-lttxd gateway Log message from gateway
service-1786497219-lttxd server Log message from server
service-1786497219-2rbt1 server Log message from server

In addition, if a pod is killed and recreated during a deployment Stern will stop listening to the old pod and automatically hook into the new one. There's no more need to figure out what the id of that newly created pod is.

Configuration options

Stern was deliberately designed to be minimal so there's not much to it. However, there are still a couple configuration options we can highlight here. They're very similar to the ones built into kubectl so if you're familiar with that you should feel right at home.
  • --timestamps adds the timestamp to each line
  • --since shows log entries since a certain time (for instance --since 15min)
  • --kube-config allows you to specify another Kubernetes config. Defaults to ~/.kube/config
  • --namespace allows you to only limit the search to a certain namespaceRun stern --help for all options.
Examples

Tail the gateway container running inside of the envvars pod on staging
     stern --context staging --container gateway envvars
Show auth activity from 15min ago with timestamps
     stern -t --since 15m auth
Follow the development of some-new-feature in minikube
     stern --context minikube some-new-feature
View pods from another namespace
     stern --namespace kube-system kubernetes-dashboard

Get Stern

Stern is open source and available on GitHub, we'd love your contributions or ideas. If you don't want to build from source you can also download a precompiled binary from GitHub releases


Introducing Kubernetes Service Partners program and a redesigned Partners page

$
0
0
Kubernetes has become a leading container orchestration system by being a powerful and flexible way to run distributed systems at scale. Through our very active open source community, equating to hundreds of person years of work, Kubernetes achieved four major releases in just one year to become a critical part of thousands of companies infrastructures. However, even with all that momentum, adopting cloud native computing is a significant transition for many organizations. It can be challenging to adopt a new methodology, and many teams are looking for advice and support through that journey.

Today, we’re excited to launch the Kubernetes Service Partners program. A Service Partner is a company that provides support and consulting for customers building applications on Kubernetes. This program is an addition to our existing Kubernetes Technology Partners who provide software and offer support services for their software. 

The Service Partners provide hands-on best practice guidance for running your apps on Kubernetes, and are available to work with companies of all sizes to get started; the first batch of participants includes: Apprenda, Container Solutions, Deis, Livewyer, ReactiveOps and Samsung SDS. You’ll find their listings along with our existing Technology Partners on the newly redesigned Partners Page, giving you a single view into the Kubernetes ecosystem. 

The list of partners will grow weekly, and we look forward to collaborating with the community to build a vibrant Kubernetes ecosystem.


--Allan Naim, Product Manager, Google, on behalf of the Kubernetes team.


Modernizing the Skytap Cloud Micro-Service Architecture with Kubernetes

$
0
0
Editor's note: Today’s guest post is by the Tools and Infrastructure Engineering team at Skytap, a public cloud provider focused on empowering DevOps workflows, sharing their experience on adopting Kubernetes. 

Skytap is a global public cloud that provides our customers the ability to save and clone complex virtualized environments in any given state. Our customers include enterprise organizations running applications in a hybrid cloud, educational organizations providing virtual training labs, users who need easy-to-maintain development and test labs, and a variety of organizations with diverse DevOps workflows.

Some time ago, we started growing our business at an accelerated pace — our user base and our engineering organization continue to grow simultaneously. These are exciting, rewarding challenges! However, it's difficult to scale applications and organizations smoothly, and we’re approaching the task carefully. When we first began looking at improvements to scale our toolset, it was very clear that traditional OS virtualization was not going to be an effective way to achieve our scaling goals. We found that the persistent nature of VMs encouraged engineers to build and maintain bespoke ‘pet’ VMs; this did not align well with our desire to build reusable runtime environments with a stable, predictable state. Fortuitously, growth in the Docker and Kubernetes communities has aligned with our growth, and the concurrent explosion in community engagement has (from our perspective) helped these tools mature.

In this article we’ll explore how Skytap uses Kubernetes as a key component in services that handle production workloads growing the Skytap Cloud.

As we add engineers, we want to maintain our agility and continue enabling ownership of components throughout the software development lifecycle. This requires a lot of modularization and consistency in key aspects of our process. Previously, we drove reuse with systems-level packaging through our VM and environment templates, but as we scale, containers have become increasingly important as a packaging mechanism due to their comparatively lightweight and precise control of the runtime environment. 

In addition to this packaging flexibility, containers help us establish more efficient resource utilization, and they head off growing complexity arising from the natural inclination of teams to mix resources into large, highly-specialized VMs. For example, our operations team would install tools for monitoring health and resource utilization, a development team would deploy a service, and the security team might install traffic monitoring; combining all of that into a single VM greatly increases the test burden and often results in surprises—oops, you pulled in a new system-level Ruby gem!

Containerization of individual components in a service is pretty trivial with Docker. Getting started is easy, but as anyone who has built a distributed system with more than a handful of components knows, the real difficulties are deployment, scaling, availability, consistency, and communication between each unit in the cluster.

Let’s containerize! 

We’d begun to trade a lot of our heavily-loved pet VMs for, as the saying goes, cattle. 
_____
/ Moo \
\---- /
       \   ^__^
        \  (oo)\_______
           (__)\       )\/\
               ||----w |
               ||     ||

The challenges of distributed systems aren’t simplified by creating a large herd of free-range containers, though. When we started using containers, we recognized the need for a container management framework. We evaluated Docker Swarm, Mesosphere, and Kubernetes, but we found that the Mesosphere usage model didn’t match our needs — we need the ability to manage discrete VMs; this doesn’t match the Mesosphere ‘distributed operating system’ model — and Docker Swarm was still not mature enough. So, we selected Kubernetes.  

Launching Kubernetes and building a new distributed service is relatively easy (inasmuch as this can be said for such a service: you can’t beat CAP theorem). However, we need to integrate container management with our existing platform and infrastructure. Some components of the platform are better served by VMs, and we need the ability to containerize services iteratively. 
We broke this integration problem down into four categories: 
  1. Service control and deployment
  2. Inter-service communication
  3. Infrastructure integration
  4. Engineering support and education
Service Control and Deployment

We use a custom extension of Capistrano (we call it ‘Skycap’) to deploy services and manage those services at runtime. It is important for us to manage both containerized and classic services through a single, well-established framework. We also need to isolate Skycap from the inevitable breaking changes inherent in an actively-developed tool like Kubernetes. 

To handle this, we use wrappers in to our service control framework that isolate kubectl behind Skycap and handle issues like ignoring spurious log messages.

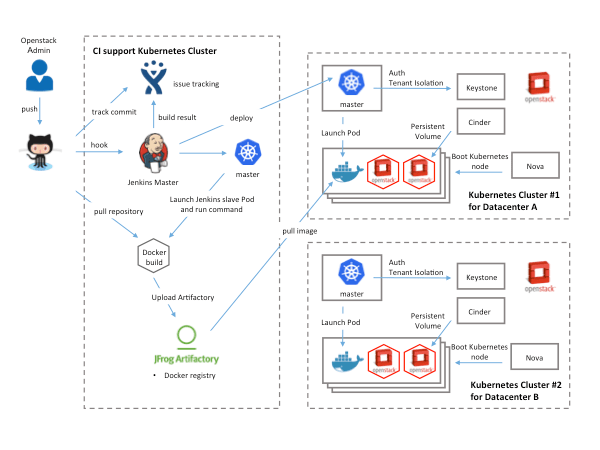
Deployment adds a layer of complexity for us. Docker images are a great way to package software, but historically, we’ve deployed from source, not packages. Our engineering team expects that making changes to source is sufficient to get their work released; devs don’t expect to handle additional packaging steps. Rather than rebuild our entire deployment and orchestration framework for the sake of containerization, we use a continuous integration pipeline for our containerized services. We automatically build a new Docker image for every commit to a project, and then we tag it with the Mercurial (Hg) changeset number of that commit. On the Skycap side, a deployment from a specific Hg revision will then pull the Docker images that are tagged with that same revision number. 

We reuse container images across multiple environments. This requires environment-specific configuration to be injected into each container instance. Until recently, we used similar source-based principles to inject these configuration values: each container would copy relevant configuration files from Hg by cURL-ing raw files from the repo at run time. Network availability and variability are a challenge best avoided, though, so we now load the configuration into Kubernetes’ ConfigMap feature. This not only simplifies our Docker images, but it also makes pod startup faster and more predictable (because containers don’t have to download files from Hg).   

Inter-service communication

Our services communicate using two primary methods. The first, message brokering, is typical for process-to-process communication within the Skytap platform. The second is through direct point-to-point TCP connections, which are typical for services that communicate with the outside world (such as web services). We’ll discuss the TCP method in the next section, as a component of infrastructure integration. 

Managing direct connections between pods in a way that services can understand is complicated. Additionally, our containerized services need to communicate with classic VM-based services. To mitigate this complexity, we primarily use our existing message queueing system. This helped us avoid writing a TCP-based service discovery and load balancing system for handling traffic between pods and non-Kubernetes services. 

This reduces our configuration load—services only need to know how to talk to the message queues, rather than to every other service they need to interact with. We have additional flexibility for things like managing the run-state of pods; messages buffer in the queue while nodes are restarting, and we avoid the overhead of re-configuring TCP endpoints each time a pod is added or removed from the cluster. Furthermore, the MQ model allows us to manage load balancing with a more accurate ‘pull’ based approach, in which recipients determine when they are ready to process a new message, instead of using heuristics like ‘least connections’ that simply count the number of open sockets to estimate load.  

Migrating MQ-enabled services to Kubernetes is relatively straightforward compared to migrating services that use the complex TCP-based direct or load balanced connections. Additionally, the isolation provided by the message broker means that the switchover from a classic service to a container-based service is essentially transparent to any other MQ-enabled service. 

Infrastructure Integration

As an infrastructure provider, we face some unique challenges in configuring Kubernetes for use with our platform. AWS& GCP provide out-of-box solutions that simplify Kubernetes provisioning but make assumptions about the underlying infrastructure that do not match our reality. Some organizations have purpose-built data centers. This option would have required us to abandon our existing load balancing infrastructure, our Puppet based provisioning system and the expertise we’d built up around these tools. We weren’t interested in abandoning the tools or our vested experience, so we needed a way to manage Kubernetes that could integrate with our world instead of rebuild it.

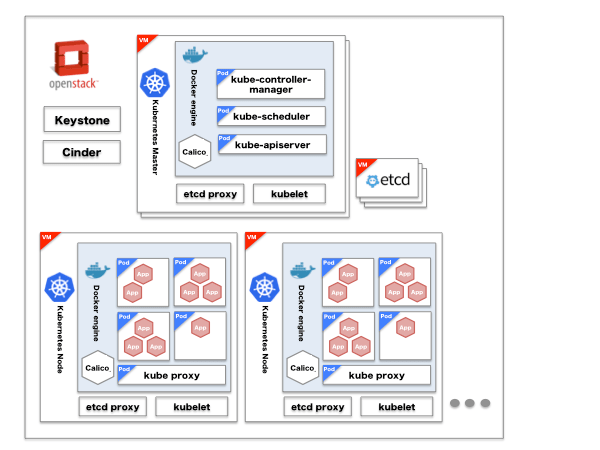
So, we use Puppet to provision and configure VMs that, in turn, run the Skytap Platform. We wrote custom deployment scripts to install Kubernetes on these, and we coordinate with our operations team to do capacity planning for Kube-master and Kube-node hosts. 

In the previous section, we mentioned point-to-point TCP-based communication. For customer-facing services, the pods need a way to interface with Skytap’s layer 3 network infrastructure. Examples at Skytap include our web applications and API over HTTPS, Remote Desktop over Web Sockets, FTP, TCP/UDP port forwarding services, full public IPs, etc. We need careful management of network ingress and egress for this external traffic, and have historically used F5 load balancers. The MQ infrastructure for internal services is inadequate for handling this workload because the protocols used by various clients (like web browsers) are very specific and TCP is the lowest common denominator.

To get our load balancers communicating with our Kubernetes pods, we run the kube-proxy on each node. Load balancers route to the node, and kube-proxy handles the final handoff to the appropriate pod.

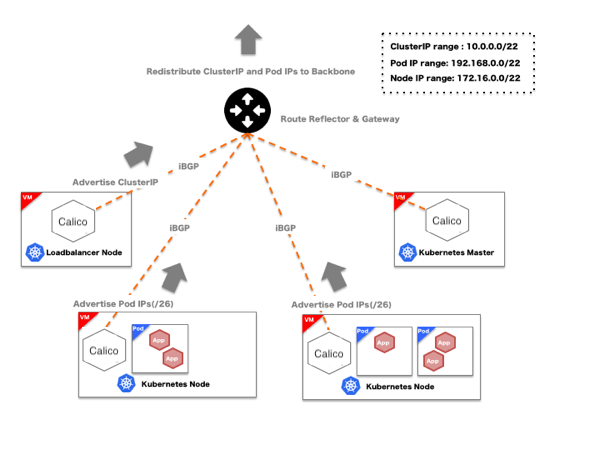
We mustn’t forget that Kubernetes needs to route traffic between pods (for both TCP-based and MQ-based messaging). We use the Calico plugin for Kubernetes networking, with a specialized service to reconfigure the F5 when Kubernetes launches or reaps pods. Calico handles route advertisement with BGP, which eases integration with the F5.

F5s also need to have their load balancing pool reconfigured when pods enter or leave the cluster. The F5 appliance maintains a pool of load-balanced back-ends; ingress to a containerized service is directed through this pool to one of the nodes hosting a service pod. This is straightforward for static network configurations – but since we're using Kubernetes to manage pod replication and availability, our networking situation becomes dynamic. To handle changes, we have a 'load balancer' pod that monitors the Kubernetes svc object for changes; if a pod is removed or added, the ‘load balancer’ pod will detect this change through the svc object, and then update the F5 configuration through the appliance's web API. This way, Kubernetes transparently handles replication and failover/recovery, and the dynamic load balancer configuration lets this process remain invisible to the service or user who originated the request. Similarly, the combination of the Calico virtual network plus the F5 load balancer means that TCP connections should behave consistently for services that are running on both the traditional VM infrastructure, or that have been migrated to containers. 

kubernetes_f5_messaging.png

With dynamic reconfiguration of the network, the replication mechanics of Kubernetes make horizontal scaling and (most) failover/recovery very straightforward. We haven’t yet reached the reactive scaling milestone, but we've laid the groundwork with the Kubernetes and Calico infrastructure, making one avenue to implement it straightforward:
  • Configure upper and lower bounds for service replication
  • Build a load analysis and scaling service (easy, right?)
  • If load patterns match the configured triggers in the scaling service (for example, request rate or volume above certain bounds), issue: kubectl scale --replicas=COUNT rc NAME
This would allow us fine-grained control of autoscaling at the platform level, instead of from the applications themselves – but we’ll also evaluate Horizontal Pod Autoscaling in Kubernetes; which may suit our need without a custom service. 

Keep an eye on our GitHub account and the Skytap blog; as our solutions to problems like these mature, we hope to share what we’ve built with the open source community.

Engineering Support

A transition like our containerization project requires the engineers involved in maintaining and contributing to the platform change their workflow and learn new methods for creating and troubleshooting services. 

Because a variety of learning styles require a multi-faceted approach, we handle this in three ways: with documentation, with direct outreach to engineers (that is, brownbag sessions or coaching teams), and by offering easy-to-access, ad-hoc support.  

We continue to curate a collection of documents that provide guidance on transitioning classic services to Kubernetes, creating new services, and operating containerized services. Documentation isn’t for everyone, and sometimes it’s missing or incomplete despite our best efforts, so we also run an internal #kube-help Slack channel, where anyone can stop in for assistance or arrange a more in-depth face-to-face discussion.

We have one more powerful support tool: we automatically construct and test prod-like environments that include this Kubernetes infrastructure, which allows engineers a lot of freedom to experiment and work with Kubernetes hands-on. We explore the details of automated environment delivery in more detail in this post.

Final Thoughts

We’ve had great success with Kubernetes and containerization in general, but we’ve certainly found that integrating with an existing full-stack environment has presented many challenges. While not exactly plug-and-play from an enterprise lifecycle standpoint, the flexibility and configurability of Kubernetes still remains a very powerful tool for building our modularized service ecosystem.

We love application modernization challenges. The Skytap platform is well suited for these sorts of migration efforts – we run Skytap in Skytap, of course, which helped us tremendously in our Kubernetes integration project. If you’re planning modernization efforts of your own, connect with us, we’re happy to help.

--Shawn Falkner-Horine and Joe Burchett, Tools and Infrastructure Engineering, Skytap


Bringing Kubernetes Support to Azure Container Service

$
0
0
Editor's note: Today’s post is by Brendan Burns, Partner Architect, at Microsoft & Kubernetes co-founder talking about bringing Kubernetes to Azure Container Service.

With more than a thousand people coming to KubeCon in my hometown of Seattle, nearly three years after I helped start the Kubernetes project, it’s amazing and humbling to see what a small group of people and a radical idea have become after three years of hard work from a large and growing community. In July of 2014, scarcely a month after Kubernetes became publicly available, Microsoft announced its initial support for Azure. The release of Kubernetes 1.4, brought support for native Microsoft networking, load-balancer and disk integration

Today, Microsoft announced the next step in Kubernetes on Azure: the introduction of Kubernetes as a supported orchestrator in Azure Container Service (ACS). It’s been really exciting for me to join the ACS team and help build this new addition. The integration of Kubernetes into ACS means that with a few clicks in the Azure portal, or by running a single command in the new python-based Azure command line tool, you will be able to create a fully functional Kubernetes cluster that is integrated with the rest of your Azure resources.

Kubernetes is availabe in public preview in Azure Container Service today. Community participation has always been an important part of the Kubernetes experience. Over the next few months, I hope you’ll join us and provide your feedback on the experience as we bring it to general availability.

In the spirit of community, we are also excited to announce a new open source project: ACS Engine. The goal of ACS Engine is to provide an open, community driven location to develop and share best practices for orchestrating containers on Azure. All of our knowledge of running containers in Azure has been captured in that repository, and we look forward to improving and extending it as we move forward with the community. Going forward, the templates in ACS Engine will be the basis for clusters deployed via the ACS API, and thus community driven improvements, features and more will have a natural path into the Azure Container Service. We’re excited to invite you to join us in improving ACS. Prior to the creation of ACS Engine, customers with unique requirements not supported by the ACS API needed to maintain variations on our templates. While these differences start small, they grew largerer over time as the mainline template was improved and users also iterated their templates. These differences and drift really impact the ability for users to collaborate, since their templates are all different. Without the ability to share and collaborate, it’s difficult to form a community since every user is siloed in their own variant.

To solve this problem, the core of ACS Engine is a template processor, built in Go, that enables you to dynamically combine different pieces of configuration together to form a final template that can be used to build up your cluster. Thus, each user can mix and match the pieces build the final container cluster that suits their needs. At the same time, each piece can be built and maintained collaboratively by the community. We’ve been beta testing this approach with some customers and the feedback we’ve gotten so far has been really positive.

Beyond services to help you run containers on Azure, I think it’s incredibly important to improve the experience of developing and deploying containerized applications to Kubernetes. To that end, I’ve been doing a bunch of work lately to build a Kubernetes extension for the really excellent, open source, Visual Studio Code. The Kubernetes extension enables you to quickly deploy JSON or YAML files you are editing onto a Kubernetes cluster. Additionally, it enables you to import existing Kubernetes objects into Code for easy editing. Finally, it enables synchronization between your running containers and the source code that you are developing for easy debugging of issues you are facing in production.

But really, a demo is worth a thousand words, so please have a look at this video:


Of course, like everything else in Kubernetes it’s released as open source, and I look forward to working on it further with the community. Thanks again, I look forward to seeing everyone at the OpenShift Gathering today, as well as at the Microsoft Azure booth during KubeCon tomorrow and Wednesday. Welcome to Seattle!


Viewing all 290 articles
Browse latest View live