Quantcast
Channel: Kubernetes – Production-Grade Container Orchestration
Viewing all 290 articles
Browse latest View live

AppC Support for Kubernetes through RKT

$
0
0
We very recently accepted a pull request to the Kubernetes project to add appc support for the Kubernetes community.  Appc is a new open container specification that was initiated by CoreOS, and is supported through CoreOS rkt container runtime.

This is an important step forward for the Kubernetes project and for the broader containers community.  It adds flexibility and choice to the container-verse and brings the promise of  compelling new security and performance capabilities to the Kubernetes developer.

Container based runtimes (like Docker or rkt) when paired with smart orchestration technologies (like Kubernetes and/or Apache Mesos) are a legitimate disruption to the way that developers build and run their applications.  While the supporting technologies are relatively nascent, they do offer the promise of some very powerful new ways to assemble, deploy, update, debug and extend solutions.  I believe that the world has not yet felt the full potential of containers and the next few years are going to be particularly exciting!  With that in mind it makes sense for several projects to emerge with different properties and different purposes. It also makes sense to be able to plug together different pieces (whether it be the container runtime or the orchestrator) based on the specific needs of a given application.

Docker has done an amazing job of democratizing container technologies and making them accessible to the outside world, and we expect Kubernetes to support Docker indefinitely. CoreOS has also started to do interesting work with rkt to create an elegant, clean, simple and open platform that offers some really interesting properties.  It looks poised deliver a secure and performant operating environment for containers.  The Kubernetes team has been working with the appc team at CoreOS for a while and in many ways they built rkt with Kubernetes in mind as a simple pluggable runtime component.  

The really nice thing is that with Kubernetes you can now pick the container runtime that works best for you based on your workloads’ needs, change runtimes without having the replace your cluster environment, or even mix together applications where different parts are running in different container runtimes in the same cluster.  Additional choices can’t help but ultimately benefit the end developer.

-- Craig McLuckie
Google Product Manager and Kubernetes co-founder


Kubernetes Release: 0.16.0

$
0
0
Release Notes:
  • Bring up a kuberenetes cluster using coreos image as worker nodes #7445 (dchen1107)
  • Cloning v1beta3 as v1 and exposing it in the apiserver #7454 (nikhiljindal)
  • API Conventions for Late-initializers #7366 (erictune)
  • Upgrade Elasticsearch to 1.5.2 for cluster logging #7455 (satnam6502)
  • Make delete actually stop resources by default. #7210 (brendandburns)
  • Change kube2sky to use token-system-dns secret, point at https endpoint ... #7154(cjcullen)
  • Updated CoreOS bare metal docs for 0.15.0 #7364 (hvolkmer)
  • Print named ports in 'describe service'#7424 (thockin)
  • AWS
  • Return public & private addresses in GetNodeAddresses #7040 (justinsb)
  • Improving getting existing VPC and subnet #6606 (gust1n)
  • Set hostname_override for minions, back to fully-qualified name #7182 (justinsb)
  • Conversion to v1beta3
  • Convert node level logging agents to v1beta3 #7274 (satnam6502)
  • Removing more references to v1beta1 from pkg/ #7128 (nikhiljindal)
  • update examples/cassandra to api v1beta3 #7258 (caesarxuchao)
  • Convert Elasticsearch logging to v1beta3 and de-salt #7246 (satnam6502)
  • Update examples/storm for v1beta3 #7231 (bcbroussard)
  • Update examples/spark for v1beta3 #7230 (bcbroussard)
  • Update Kibana RC and service to v1beta3 #7240 (satnam6502)
  • Updating the guestbook example to v1beta3 #7194 (nikhiljindal)
  • Update Phabricator to v1beta3 example #7232 (bcbroussard)
  • Update Kibana pod to speak to Elasticsearch using v1beta3 #7206 (satnam6502)
  • Validate Node IPs; clean up validation code #7180 (ddysher)
  • Add PortForward to runtime API. #7391 (vmarmol)
  • kube-proxy uses token to access port 443 of apiserver #7303 (erictune)
  • Move the logging-related directories to where I think they belong #7014 (a-robinson)
  • Make client service requests use the default timeout now that external load balancers are created asynchronously #6870 (a-robinson)
  • Fix bug in kube-proxy of not updating iptables rules if a service's public IPs change #6123(a-robinson)
  • PersistentVolumeClaimBinder #6105 (markturansky)
  • Fixed validation message when trying to submit incorrect secret #7356 (soltysh)
  • First step to supporting multiple k8s clusters #6006 (justinsb)
  • Parity for namespace handling in secrets E2E #7361 (pmorie)
  • Add cleanup policy to RollingUpdater #6996 (ironcladlou)
  • Use narrowly scoped interfaces for client access #6871 (ironcladlou)
  • Warning about Critical bug in the GlusterFS Volume Plugin #7319 (wattsteve)
  • Rolling update
  • First part of improved rolling update, allow dynamic next replication controller generation. #7268 (brendandburns)
  • Further implementation of rolling-update, add rename #7279 (brendandburns)
  • Added basic apiserver authz tests. #7293 (ashcrow)
  • Retry pod update on version conflict error in e2e test. #7297 (quinton-hoole)
  • Add "kubectl validate" command to do a cluster health check. #6597 (fabioy)
  • coreos/azure: Weave version bump, various other enhancements #7224 (errordeveloper)
  • Azure: Wait for salt completion on cluster initialization #6576 (jeffmendoza)
  • Tighten label parsing #6674 (kargakis)
  • fix watch of single object #7263 (lavalamp)
  • Upgrade go-dockerclient dependency to support CgroupParent #7247 (guenter)
  • Make secret volume plugin idempotent #7166 (pmorie)
  • Salt reconfiguration to get rid of nginx on GCE #6618 (roberthbailey)
  • Revert "Change kube2sky to use token-system-dns secret, point at https e... #7207 (fabioy)
  • Pod templates as their own type #5012 (smarterclayton)
  • iscsi Test: Add explicit check for attach and detach calls. #7110 (swagiaal)
  • Added field selector for listing pods #7067 (ravigadde)
  • Record an event on node schedulable changes #7138 (pravisankar)
  • Resolve #6812, limit length of load balancer names #7145 (caesarxuchao)
  • Convert error strings to proper validation errors. #7131 (rjnagal)
  • ResourceQuota add object count support for secret and volume claims #6593(derekwaynecarr)
  • Use Pod.Spec.Host instead of Pod.Status.HostIP for pod subresources #6985 (csrwng)
  • Prioritize deleting the non-running pods when reducing replicas #6992 (yujuhong)
  • Kubernetes UI with Dashboard component #7056 (preillyme)
To download, please visit https://github.com/GoogleCloudPlatform/kubernetes/releases/tag/v0.16.0

Weekly Kubernetes Community Hangout Notes - May 1 2015

$
0
0


Every week the Kubernetes contributing community meet virtually over Google Hangouts. We want anyone who's interested to know what's discussed in this forum.

  • Simple rolling update - Brendan
    • Rolling update = nice example of why RCs and Pods are good.
    • ...pause… (Brendan needs demo recovery tips from Kelsey)
    • Rolling update has recovery: Cancel update and restart, update continues from where it stopped.
    • New controller  gets name of old controller, so appearance is pure update.
    • Can also name versions in update (won’t do rename at the end).
  • Rocket demo - CoreOS folks
    • 2 major differences between rocket & docker: Rocket is daemonless & pod-centric.
    • Rocket has AppContainer format as native, but also supports docker image format.
    • Can run AppContainer and docker containers in same pod.
    • Changes are close to merged.
  • demo service accounts and secrets being added to pods - Jordan
    • Problem: It’s hard to get a token to talk to the API.
    • New API object: “ServiceAccount”
    • ServiceAccount is namespaced, controller makes sure that at least 1 default service account exists in a namespace.
    • Typed secret “ServiceAccountToken”, controller makes sure there is at least 1 default token.
    • DEMO
    • Can use token from default service account to curl https://apiserver
    • Can create new service account with ServiceAccountToken. Controller will create token for it.
    • Can create a pod with service account, pods will have service account secret mounted at /var/run/secrets/kubernetes.io/…
  • Kubelet running in a container - Paul
    • Kubelet successfully ran pod w/ mounted secret.

Resource Usage Monitoring in Kubernetes

$
0
0
Understanding how an application behaves when deployed is crucial to scaling the application and providing a reliable service. In a Kubernetes cluster, application performance can be examined at many different levels: containers, pods, services, and whole clusters. As part of Kubernetes we want to provide users with detailed resource usage information about their running applications at all these levels. This will give users deep insights into how their applications are performing and where possible application bottlenecks may be found. In comes Heapster, a project meant to provide a base monitoring platform on Kubernetes.

Overview


Heapster is a cluster-wide aggregator of monitoring and event data. It runs as a pod in the cluster, similar to how any Kubernetes application would run. The Heapster pod discovers all nodes in the cluster and queries usage information from the nodes’ Kubelets, the on-machine Kubernetes agent. The Kubelet itself fetches the data from cAdvisor. Heapster groups the information by pod along with the relevant labels. This data is then pushed to a configurable backend for storage and visualization. Currently supported backends include InfluxDB (with Grafana for visualization) and Google Cloud Monitoring. The overall architecture of the service can be seen below:


Let’s look at some of the other components in more detail.


cAdvisor


cAdvisor is an open source container resource usage and performance analysis agent. It is purpose built for containers and supports Docker containers natively. In Kubernetes, cadvisor is integrated into the Kubelet binary. cAdvisor auto-discovers all containers in the machine and collects CPU, memory, filesystem, and network usage statistics. cAdvisor also provides the overall machine usage by analyzing the “root” container on the machine.


On most Kubernetes clusters, cAdvisor exposes a simple UI for on-machine containers on port 4194. Here is a snapshot of part of cAdvisor’s UI that shows the overall machine usage:
cadvisor.png

Kubelet


The Kubelet acts as a bridge between the Kubernetes master and the nodes. It manages the pods and containers running on a machine. Kubelet translates each pod into its constituent containers and fetches individual container usage statistics from cAdvisor. It then exposes the aggregated pod resource usage statistics via a REST API.


Storage Backends


InfluxDB and Grafana


A Grafana setup with InfluxDB is a very popular combination for monitoring in the open source world. InfluxDB exposes an easy to use API to write and fetch time series data. Heapster is setup to use this storage backend by default on most kubernetes clusters. A detailed setup guide can be found here. InfluxDB and Grafana run in Pods. The pod exposes itself as a Kubernetes service which is how Heapster discovers it.


The Grafana container serves Grafana’s UI which provides an easy to configure dashboard interface. The default dashboard for Kubernetes contains an example dashboard that monitors resource usage of the cluster and the pods inside of it. This dashboard can easily be customized and expanded. Take a look at the storage schema for InfluxDB here.


Here is a video showing how to monitor a kubernetes cluster using heapster, InfluxDB and Grafana.


Here is a snapshot of the default Kubernetes Grafana dashboard that shows the CPU and Memory usage of the entire cluster, individual pods and containers:

influx.png

Google Cloud Monitoring


Google Cloud Monitoring is a hosted monitoring service that allows you to visualize and alert on important metrics in your application. Heapster can be setup to automatically push all collected metrics to Google Cloud Monitoring. These metrics are then available in the Cloud Monitoring Console. This storage backend is the easiest to setup and maintain. The monitoring console allows you to easily create and customize dashboards using the exported data.


Here is a video showing how to setup and run a Google Cloud Monitoring backed Heapster.


Here is a snapshot of the a Google Cloud Monitoring dashboard showing cluster-wide resource usage.
gcm.png

Try it out!

Now that you’ve learned a bit about Heapster, feel free to try it out on your own clusters! The Heapster repository is available on GitHub. It contains detailed instructions to setup Heapster and its storage backends. Heapster runs by default on most Kubernetes clusters, so you may already have it! Feedback is always welcome. Please let us know if you run into any issues. Heapster and Kubernetes developers hang out in the #google-containers IRC channel on freenode.net. You can also reach us on the google-containers Google Groups mailing list.

 - Authors: Vishnu Kannan and Victor Marmol, Google Software Engineers

Kubernetes Release: 0.17.0

$
0
0

Release Notes:
  • Cleanups
    • Remove old salt configs #8065 (roberthbailey)
    • Kubelet: minor cleanups #8069 (yujuhong)
  • v1beta3
    • update example/walkthrough to v1beta3 #7940 (caesarxuchao)
    • update example/rethinkdb to v1beta3 #7946 (caesarxuchao)
    • verify the v1beta3 yaml files all work; merge the yaml files #7917 (caesarxuchao)
    • update examples/cassandra to api v1beta3 #7258 (caesarxuchao)
    • update service.json in persistent-volume example to v1beta3 #7899 (caesarxuchao)
    • update mysql-wordpress example to use v1beta3 API #7864 (caesarxuchao)
    • Update examples/meteor to use API v1beta3 #7848 (caesarxuchao)
    • update node-selector example to API v1beta3 #7872 (caesarxuchao)
    • update logging-demo to use API v1beta3; modify the way to access Elasticsearch and Kibana services #7824 (caesarxuchao)
    • Convert the skydns rc to use v1beta3 and add a health check to it #7619 (a-robinson)
    • update the hazelcast example to API version v1beta3 #7728 (caesarxuchao)
    • Fix YAML parsing for v1beta3 objects in the kubelet for file/http #7515 (brendandburns)
    • Updated kubectl cluster-info to show v1beta3 addresses #7502 (piosz)
  • Kubelet
    • kubelet: Fix racy kubelet tests. #7980 (yifan-gu)
    • kubelet/container: Move prober.ContainerCommandRunner to container. #8079 (yifan-gu)
    • Kubelet: set host field in the pending pod status #6127 (yujuhong)
    • Fix the kubelet node watch #6442 (yujuhong)
    • Kubelet: recreate mirror pod if the static pod changes #6607 (yujuhong)
    • Kubelet: record the timestamp correctly in the runtime cache #7749 (yujuhong)
    • Kubelet: wait until container runtime is up #7729 (yujuhong)
    • Kubelet: replace DockerManager with the Runtime interface #7674 (yujuhong)
    • Kubelet: filter out terminated pods in SyncPods #7301 (yujuhong)
    • Kubelet: parallelize cleaning up containers in unwanted pods #7048 (yujuhong)
    • kubelet: Add container runtime option for rkt. #7952 (yifan-gu)
    • kubelet/rkt: Remove build label. #7916 (yifan-gu)
    • kubelet/metrics: Move instrumented_docker.go to dockertools. #7327 (yifan-gu)
    • kubelet/rkt: Add GetPods() for rkt. #7599 (yifan-gu)
    • kubelet/rkt: Add KillPod() and GetPodStatus() for rkt. #7605 (yifan-gu)
    • pkg/kubelet: Fix logging. #4755 (yifan-gu)
    • kubelet: Refactor RunInContainer/ExecInContainer/PortForward. #6491 (yifan-gu)
    • kubelet/DockerManager: Fix returning empty error from GetPodStatus(). #6609 (yifan-gu)
    • kubelet: Move pod infra container image setting to dockertools. #6634 (yifan-gu)
    • kubelet/fake_docker_client: Use self's PID instead of 42 in testing. #6653 (yifan-gu)
    • kubelet/dockertool: Move Getpods() to DockerManager. #6778 (yifan-gu)
    • kubelet/dockertools: Add puller interfaces in the containerManager. #6776 (yifan-gu)
    • kubelet: Introduce PodInfraContainerChanged(). #6608 (yifan-gu)
    • kubelet/container: Replace DockerCache with RuntimeCache. #6795 (yifan-gu)
    • kubelet: Clean up computePodContainerChanges. #6844 (yifan-gu)
    • kubelet: Refactor prober. #7009 (yifan-gu)
    • kubelet/container: Update the runtime interface. #7466 (yifan-gu)
    • kubelet: Refactor isPodRunning() in runonce.go #7477 (yifan-gu)
    • kubelet/rkt: Add basic rkt runtime routines. #7465 (yifan-gu)
    • kubelet/rkt: Add podInfo. #7555 (yifan-gu)
    • kubelet/container: Add GetContainerLogs to runtime interface. #7488 (yifan-gu)
    • kubelet/rkt: Add routines for converting kubelet pod to rkt pod. #7543 (yifan-gu)
    • kubelet/rkt: Add RunPod() for rkt. #7589 (yifan-gu)
    • kubelet/rkt: Add RunInContainer()/ExecInContainer()/PortForward(). #7553 (yifan-gu)
    • kubelet/container: Move ShouldContainerBeRestarted() to runtime. #7613 (yifan-gu)
    • kubelet/rkt: Add SyncPod() to rkt. #7611 (yifan-gu)
    • Kubelet: persist restart count of a container #6794 (yujuhong)
    • kubelet/container: Move pty*.go to container runtime package. #7951 (yifan-gu)
    • kubelet: Add container runtime option for rkt. #7900 (yifan-gu)
    • kubelet/rkt: Add docker prefix to image string. #7803 (yifan-gu)
    • kubelet/rkt: Inject dependencies to rkt. #7849 (yifan-gu)
    • kubelet/rkt: Remove dependencies on rkt.store #7859 (yifan-gu)
    • Kubelet talks securely to apiserver #2387 (erictune)
    • Rename EnvVarSource.FieldPath -> FieldRef and add example #7592 (pmorie)
    • Add containerized option to kubelet binary #7741 (pmorie)
    • Ease building kubelet image #7948 (pmorie)
    • Remove unnecessary bind-mount from dockerized kubelet run #7854 (pmorie)
    • Add ability to dockerize kubelet in local cluster #7798 (pmorie)
    • Create docker image for kubelet #7797 (pmorie)
    • Security context - types, kubelet, admission #7343 (pweil-)
    • Kubelet: Add rkt as a runtime option #7743 (vmarmol)
    • Fix kubelet's docker RunInContainer implementation #7746 (vishh)
  • AWS
    • AWS: Don't try to copy gce_keys in jenkins e2e job #8018 (justinsb)
    • AWS: Copy some new properties from config-default => config.test #7992 (justinsb)
    • AWS: make it possible to disable minion public ip assignment #7928 (manolitto)
    • update AWS CloudFormation template and cloud-configs #7667 (antoineco)
    • AWS: Fix variable naming that meant not all tokens were written #7736 (justinsb)
    • AWS: Change apiserver to listen on 443 directly, not through nginx #7678 (justinsb)
    • AWS: Improving getting existing VPC and subnet #6606 (gust1n)
    • AWS EBS volume support #5138 (justinsb)
  • Introduce an 'svc' segment for DNS search #8089 (thockin)
  • Adds ability to define a prefix for etcd paths #5707 (kbeecher)
  • Add kubectl log --previous support to view last terminated container log #7973 (dchen1107)
  • Add a flag to disable legacy APIs #8083 (brendandburns)
  • make the dockerkeyring handle mutiple matching credentials #7971 (deads2k)
  • Convert Fluentd to Cloud Logging pod specs to YAML #8078 (satnam6502)
  • Use etcd to allocate PortalIPs instead of in-mem #7704 (smarterclayton)
  • eliminate auth-path #8064 (deads2k)
  • Record failure reasons for image pulling #7981 (yujuhong)
  • Rate limit replica creation #7869 (bprashanth)
  • Upgrade to Kibana 4 for cluster logging #7995 (satnam6502)
  • Added name to kube-dns service #8049 (piosz)
  • Fix validation by moving it into the resource builder. #7919 (brendandburns)
  • Add cache with multiple shards to decrease lock contention #8050 (fgrzadkowski)
  • Delete status from displayable resources #8039 (nak3)
  • Refactor volume interfaces to receive pod instead of ObjectReference #8044 (pmorie)
  • fix kube-down for provider gke #7565 (jlowdermilk)
  • Service port names are required for multi-port #7786 (thockin)
  • Increase disk size for kubernetes master. #8051 (fgrzadkowski)
  • expose: Load input object for increased safety #7774 (kargakis)
  • Improments to conversion methods generator #7896 (wojtek-t)
  • Added displaying external IPs to kubectl cluster-info #7557 (piosz)
  • Add missing Errorf formatting directives #8037 (shawnps)
  • Add startup code to apiserver to migrate etcd keys #7567 (kbeecher)
  • Use error type from docker go-client instead of string #8021 (ddysher)
  • Accurately get hardware cpu count in Vagrantfile. #8024 (BenTheElder)
  • Stop setting a GKE specific version of the kubeconfig file #7921 (roberthbailey)
  • Make the API server deal with HEAD requests via the service proxy #7950 (satnam6502)
  • GlusterFS Critical Bug Resolved - Removing warning in README #7983 (wattsteve)
  • Don't use the first token uname -n as the hostname #7967 (yujuhong)
  • Call kube-down in test-teardown for vagrant. #7982 (BenTheElder)
  • defaults_tests: verify defaults when converting to an API object #6235 (yujuhong)
  • Use the full hostname for mirror pod name. #7910 (yujuhong)
  • Removes RunPod in the Runtime interface #7657 (yujuhong)
  • Clean up dockertools/manager.go and add more unit tests #7533 (yujuhong)
  • Adapt pod killing and cleanup for generic container runtime #7525 (yujuhong)
  • Fix pod filtering in replication controller #7198 (yujuhong)
  • Print container statuses in kubectl get pods #7116 (yujuhong)
  • Prioritize deleting the non-running pods when reducing replicas #6992 (yujuhong)
  • Fix locking issue in pod manager #6872 (yujuhong)
  • Limit the number of concurrent tests in integration.go #6655 (yujuhong)
  • Fix typos in different config comments #7931 (pmorie)
  • Update cAdvisor dependency. #7929 (vmarmol)
  • Ubuntu-distro: deprecate & merge ubuntu single node work to ubuntu cluster node stuff#5498 (resouer)
  • Add control variables to Jenkins E2E script #7935 (saad-ali)
  • Check node status as part of validate-cluster.sh. #7932 (fabioy)
  • Add old endpoint cleanup function #7821 (lavalamp)
  • Support recovery from in the middle of a rename. #7620 (brendandburns)
  • Update Exec and Portforward client to use pod subresource #7715 (csrwng)
  • Added NFS to PV structs #7564 (markturansky)
  • Fix environment variable error in Vagrant docs #7904 (posita)
  • Adds a simple release-note builder that scrapes the Github API for recent PRs #7616(brendandburns)
  • Scheduler ignores nodes that are in a bad state #7668 (bprashanth)
  • Set GOMAXPROCS for etcd #7863 (fgrzadkowski)
  • Auto-generated conversion methods calling one another #7556 (wojtek-t)
  • Bring up a kuberenetes cluster using coreos image as worker nodes #7445 (dchen1107)
  • Godep: Add godep for rkt. #7410 (yifan-gu)
  • Add volumeGetter to rkt. #7870 (yifan-gu)
  • Update cAdvisor dependency. #7897 (vmarmol)
  • DNS: expose 53/TCP #7822 (thockin)
  • Set NodeReady=False when docker is dead #7763 (wojtek-t)
  • Ignore latency metrics for events #7857 (fgrzadkowski)
  • SecurityContext admission clean up #7792 (pweil-)
  • Support manually-created and generated conversion functions #7832 (wojtek-t)
  • Add latency metrics for etcd operations #7833 (fgrzadkowski)
  • Update errors_test.go #7885 (hurf)
  • Change signature of container runtime PullImage to allow pull w/ secret #7861 (pmorie)
  • Fix bug in Service documentation: incorrect location of "selector" in JSON #7873(bkeroackdsc)
  • Fix controller-manager manifest for providers that don't specify CLUSTER_IP_RANGE#7876 (cjcullen)
  • Fix controller unittests #7867 (bprashanth)
  • Enable GCM and GCL instead of InfluxDB on GCE #7751 (saad-ali)
  • Remove restriction that cluster-cidr be a class-b #7862 (cjcullen)
  • Fix OpenShift example #7591 (derekwaynecarr)
  • API Server - pass path name in context of create request for subresource #7718 (csrwng)
  • Rolling Updates: Add support for --rollback. #7575 (brendandburns)
  • Update to container-vm-v20150505 (Also updates GCE to Docker 1.6) #7820 (zmerlynn)
  • Fix metric label #7830 (rhcarvalho)
  • Fix v1beta1 typos in v1beta2 conversions #7838 (pmorie)
  • skydns: use the etcd-2.x native syntax, enable IANA attributed ports. #7764(AntonioMeireles)
  • Added port 6443 to kube-proxy default IP address for api-server #7794 (markllama)
  • Added client header info for authentication doc. #7834 (ashcrow)
  • Clean up safe_format_and_mount spam in the startup logs #7827 (zmerlynn)
  • Set allocate_node_cidrs to be blank by default. #7829 (roberthbailey)
  • Fix sync problems in #5246 #7799 (cjcullen)
  • Fix event doc link #7823 (saad-ali)
  • Cobra update and bash completions fix #7776 (eparis)
  • Fix kube2sky flakes. Fix tools.GetEtcdVersion to work with etcd > 2.0.7 #7675 (cjcullen)
  • Change kube2sky to use token-system-dns secret, point at https endpoint ... #7154(cjcullen)
  • replica: serialize created-by reference #7468 (simon3z)
  • Inject mounter into volume plugins #7702 (pmorie)
  • bringing CoreOS cloud-configs up-to-date (against 0.15.x and latest OS' alpha) #6973(AntonioMeireles)
  • Update kubeconfig-file doc. #7787 (jlowdermilk)
  • Throw an API error when deleting namespace in termination #7780 (derekwaynecarr)
  • Fix command field PodExecOptions #7773 (csrwng)
  • Start ImageManager housekeeping in Run(). #7785 (vmarmol)
  • fix DeepCopy to properly support runtime.EmbeddedObject #7769 (deads2k)
  • fix master service endpoint system for multiple masters #7273 (lavalamp)
  • Add genbashcomp to KUBE_TEST_TARGETS #7757 (nak3)
  • Change the cloud provider TCPLoadBalancerExists function to GetTCPLoadBalancer...#7669 (a-robinson)
  • Add containerized option to kubelet binary #7772 (pmorie)
  • Fix swagger spec #7779 (pmorie)
  • FIX: Issue #7750 - Hyperkube docker image needs certificates to connect to cloud-providers#7755 (viklas)
  • Add build labels to rkt #7752 (vmarmol)
  • Check license boilerplate for python files #7672 (eparis)
  • Reliable updates in rollingupdate #7705 (bprashanth)
  • Don't exit abruptly if there aren't yet any minions right after the cluster is created. #7650(roberthbailey)
  • Make changes suggested in #7675 #7742 (cjcullen)
  • A guide to set up kubernetes multiple nodes cluster with flannel on fedora #7357(aveshagarwal)
  • Setup generators in factory #7760 (kargakis)
  • Reduce usage of time.After #7737 (lavalamp)
  • Remove node status from "componentstatuses" call. #7735 (fabioy)
  • React to failure by growing the remaining clusters #7614 (tamsky)
  • Fix typo in runtime_cache.go #7725 (pmorie)
  • Update non-GCE Salt distros to 1.6.0, fallback to ContainerVM Docker version on GCE#7740 (zmerlynn)
  • Skip SaltStack install if it's already installed #7744 (zmerlynn)
  • Expose pod name as a label on containers. #7712 (rjnagal)
  • Log which SSH key is used in e2e SSH test #7732 (mbforbes)
  • Add a central simple getting started guide with kubernetes guide. #7649 (brendandburns)
  • Explicitly state the lack of support for 'Requests' for the purposes of scheduling #7443(vishh)
  • Select IPv4-only from host interfaces #7721 (smarterclayton)
  • Metrics tests can't run on Mac #7723 (smarterclayton)
  • Add step to API changes doc for swagger regen #7727 (pmorie)
  • Add NsenterMounter mount implementation #7703 (pmorie)
  • add StringSet.HasAny #7509 (deads2k)
  • Add an integration test that checks for the metrics we expect to be exported from the master #6941 (a-robinson)
  • Minor bash update found by shellcheck.net #7722 (eparis)
  • Add --hostport to run-container. #7536 (rjnagal)
  • Have rkt implement the container Runtime interface #7659 (vmarmol)
  • Change the order the different versions of API are registered #7629 (caesarxuchao)
  • expose: Create objects in a generic way #7699 (kargakis)
  • Requeue rc if a single get/put retry on status.Replicas fails #7643 (bprashanth)
  • logs for master components #7316 (ArtfulCoder)
  • cloudproviders: add ovirt getting started guide #7522 (simon3z)
  • Make rkt-install a oneshot. #7671 (vmarmol)
  • Provide container_runtime flag to Kubelet in CoreOS. #7665 (vmarmol)
  • Boilerplate speedup #7654 (eparis)
  • Log host for failed pod in Density test #7700 (wojtek-t)
  • Removes spurious quotation mark #7655 (alindeman)
  • Add kubectl_label to custom functions in bash completion #7694 (nak3)
  • Enable profiling in kube-controller #7696 (wojtek-t)
  • Set vagrant test cluster default NUM_MINIONS=2 #7690 (BenTheElder)
  • Add metrics to measure cache hit ratio #7695 (fgrzadkowski)
  • Change IP to IP(S) in service columns for kubectl get #7662 (jlowdermilk)
  • annotate required flags for bash_completions #7076 (eparis)
  • (minor) Add pgrep debugging to etcd error #7685 (jayunit100)
  • Fixed nil pointer issue in describe when volume is unbound #7676 (markturansky)
  • Removed unnecessary closing bracket #7691 (piosz)
  • Added TerminationGracePeriod field to PodSpec and grace-period flag to kubectl stop#7432 (piosz)
  • Fix boilerplate in test/e2e/scale.go #7689 (wojtek-t)
  • Update expiration timeout based on observed latencies #7628 (bprashanth)
  • Output generated conversion functions/names #7644 (liggitt)
  • Moved the Scale tests into a scale file. #7645 #7646 (rrati)
  • Truncate GCE load balancer names to 63 chars #7609 (brendandburns)
  • Add SyncPod() and remove Kill/Run InContainer(). #7603 (vmarmol)
  • Merge release 0.16 to master #7663 (brendandburns)
  • Update license boilerplate for examples/rethinkdb #7637 (eparis)
  • First part of improved rolling update, allow dynamic next replication controller generation.#7268 (brendandburns)
  • Add license boilerplate to examples/phabricator #7638 (eparis)
  • Use generic copyright holder name in license boilerplate #7597 (eparis)
  • Retry incrementing quota if there is a conflict #7633 (derekwaynecarr)
  • Remove GetContainers from Runtime interface #7568 (yujuhong)
  • Add image-related methods to DockerManager #7578 (yujuhong)
  • Remove more docker references in kubelet #7586 (yujuhong)
  • Add KillContainerInPod in DockerManager #7601 (yujuhong)
  • Kubelet: Add container runtime option. #7652 (vmarmol)
  • bump heapster to v0.11.0 and grafana to v0.7.0 #7626 (idosh)
  • Build github.com/onsi/ginkgo/ginkgo as a part of the release #7593 (ixdy)
  • Do not automatically decode runtime.RawExtension #7490 (smarterclayton)
  • Update changelog. #7500 (brendandburns)
  • Add SyncPod() to DockerManager and use it in Kubelet #7610 (vmarmol)
  • Build: Push .md5 and .sha1 files for every file we push to GCS #7602 (zmerlynn)
  • Fix rolling update --image #7540 (bprashanth)
  • Update license boilerplate for docs/man/md2man-all.sh #7636 (eparis)
  • Include shell license boilerplate in examples/k8petstore #7632 (eparis)
  • Add --cgroup_parent flag to Kubelet to set the parent cgroup for pods #7277 (guenter)
  • change the current dir to the config dir #7209 (you-n-g)
  • Set Weave To 0.9.0 And Update Etcd Configuration For Azure #7158 (idosh)
  • Augment describe to search for matching things if it doesn't match the original resource.#7467 (brendandburns)
  • Add a simple cache for objects stored in etcd. #7559 (fgrzadkowski)
  • Rkt gc #7549 (yifan-gu)
  • Rkt pull #7550 (yifan-gu)
  • Implement Mount interface using mount(8) and umount(8) #6400 (ddysher)
  • Trim Fleuntd tag for Cloud Logging #7588 (satnam6502)
  • GCE CoreOS cluster - set master name based on variable #7569 (bakins)
  • Capitalization of KubeProxyVersion wrong in JSON #7535 (smarterclayton)
  • Make nodes report their external IP rather than the master's. #7530 (mbforbes)
  • Trim cluster log tags to pod name and container name #7539 (satnam6502)
  • Handle conversion of boolean query parameters with a value of "false" #7541 (csrwng)
  • Add image-related methods to Runtime interface. #7532 (vmarmol)
  • Test whether auto-generated conversions weren't manually edited #7560 (wojtek-t)
  • Mention :latest behavior for image version tag #7484 (colemickens)
  • readinessProbe calls livenessProbe.Exec.Command which cause "invalid memory address or nil pointer dereference". #7487 (njuicsgz)
  • Add RuntimeHooks to abstract Kubelet logic #7520 (vmarmol)
  • Expose URL() on Request to allow building URLs #7546 (smarterclayton)
  • Add a simple cache for objects stored in etcd #7288 (fgrzadkowski)
  • Prepare for chaining autogenerated conversion methods #7431 (wojtek-t)
  • Increase maxIdleConnection limit when creating etcd client in apiserver. #7353 (wojtek-t)
  • Improvements to generator of conversion methods. #7354 (wojtek-t)
  • Code to automatically generate conversion methods #7107 (wojtek-t)
  • Support recovery for anonymous roll outs #7407 (brendandburns)
  • Bump kube2sky to 1.2. Point it at https endpoint (3rd try). #7527 (cjcullen)
  • cluster/gce/coreos: Add metadata-service in node.yaml #7526 (yifan-gu)
  • Move ComputePodChanges to the Docker runtime #7480 (vmarmol)
  • Cobra rebase #7510 (eparis)
  • Adding system oom events from kubelet #6718 (vishh)
  • Move Prober to its own subpackage #7479 (vmarmol)
  • Fix parallel-e2e.sh to work on my macbook (bash v3.2) #7513 (cjcullen)
  • Move network plugin TearDown to DockerManager #7449 (vmarmol)
  • Fixes #7498 - CoreOS Getting Started Guide had invalid cloud config #7499 (elsonrodriguez)
  • Fix invalid character '"' after object key:value pair #7504 (resouer)
  • Fixed kubelet deleting data from volumes on stop (#7317). #7503 (jsafrane)
  • Fixing hooks/description to catch API fields without description tags #7482 (nikhiljindal)
  • cadvisor is obsoleted so kubelet service does not require it. #7457 (aveshagarwal)
  • Set the default namespace for events to be "default" #7408 (vishh)
  • Fix typo in namespace conversion #7446 (liggitt)
  • Convert Secret registry to use update/create strategy, allow filtering by Type #7419 (liggitt)
  • Use pod namespace when looking for its GlusterFS endpoints. #7102 (jsafrane)
  • Fixed name of kube-proxy path in deployment scripts. #7427 (jsafrane)
To download, please visit https://github.com/GoogleCloudPlatform/kubernetes/releases/tag/v0.17.0

Docker and Kubernetes and AppC

$
0
0
Recently we announced the intent in Kubernetes, our open source cluster manager, to support AppC and RKT, an alternative container format that has been driven by CoreOS with input from many companies (including Google).  This announcement has generated a surprising amount of buzz and has been construed as a move from Google to support Appc over Docker.  Many have taken it as signal that Google is moving away from supporting Docker.  I would like to take a moment to clarify Google’s position in this.

Google has consistently supported the Docker initiative and has invested heavily in Docker. In the early days of containers, we decided to de-emphasize our own open source offering (LMCTFY) and to instead focus on Docker.  As a result of that we have two engineers that are active maintainers of LibContainer, a critical piece of the Docker ecosystem and are working closely with Docker to add many additional features and capabilities.  Docker is currently the only supported runtime in GKE (Google Container Engine) our commercial containers product, and in GAE (Google App Engine), our Platform-as-a-Service product.  

While we may introduce AppC support at some point in the future to GKE based on our customers demand, we intend to continue to support the Docker project and product, and Docker the company indefinitely.  To date Docker is by far the most mature and widely used container offering in the market, with over 400 million downloads.  It has been production ready for almost a year and seen widespread use in industry, and also here inside Google.

Beyond the obvious traction Docker has in the market, we are heartened by many of Docker’s recent initiatives to open the project and support ‘batteries included, but swappable options across the stack and recognize that it offers a great developer experience for engineers new to the containers world.  We are encouraged, for example, by the separation of the Docker Machine and Swarm projects from the core runtime, and are glad to see support for Docker Machine emerging for Google Compute Engine.

Our intent with our announcement for AppC and RKT support was to establish Kubernetes (our open source project) as a neutral ground in the world of containers.  Customers should be able to pick their container runtime and format based solely on its technical merits, and we do see AppC as offering some legitimate potential merits as the technology matures.  Somehow this was misconstrued as an ‘a vs b’ selection which is simply untrue.  The world is almost always better for having choice, and it is perfectly natural that different tools should be available for different purposes.  

Stepping back a little, one must recognize that Docker has done remarkable work in democratizing container technologies and making them accessible to everyone.  We believe that Docker will continue to drive great experiences for developers looking to use containers and plan to support this technology and its burgeoning community indefinitely.  We, for one,  are looking forward to the upcoming Dockercon where Brendan Burns (a Kubernetes co-founder) will be talking about the role of Docker in modern distributed systems design.

-- Craig McLuckie
Google Group Product Manager, and Kubernetes Project Co-Founder

Weekly Kubernetes Community Hangout Notes - May 15 2015

$
0
0
Every week the Kubernetes contributing community meet virtually over Google Hangouts. We want anyone who's interested to know what's discussed in this forum.

  • v1 API - what's in, what's out
    • We’re trying to fix critical issues we discover with v1beta3
    • Would like to make a number of minor cleanups that will be expensive to do later
      • defaulting replication controller spec default to 1
      • deduplicating security context
      • change id field to name
      • rename host
      • inconsistent times
      • typo in container states terminated (termination vs. terminated)
      • flatten structure (requested by heavy API user)
      • pod templates - could be added after V1, field is not implemented, remove template ref field
      • in general remove any fields not implemented (can be added later)
      • if we want to change any of the identifier validation rules, should do it now
      • recently changed label validation rules to be more precise
    • Bigger changes
      • generalized label selectors
      • service - change the fields in a way that we can add features in a forward compatible manner if possible
      • public IPs - what to do from a security perspective
      • Support aci format - there is an image field - add properties to signify the image, or include it in a string
      • inconsistent on object use / cross reference - needs design discussion
    • Things to do later
      • volume source cleanup
      • multiple API prefixes
      • watch changes - watch client is not notified of progress
  • A few other proposals 
    • swagger spec fixes - ongoing
    • additional field selectors - additive, backward compatible
    • additional status - additive, backward compatible
    • elimination of phase - won’t make it for v1
  • Service discussion - Public IPs
    • with public ips as it exists we can’t go to v1
    • Tim has been developing a mitigation if we can’t get Justin’s overhaul in (but hopefully we will)
    • Justin’s fix will describe public IPs in a much better way
    • The general problem is it’s too flexible and you can do things that are scary, the mitigation is to restrict public ip usage to specific use cases -- validated public ips would be copied to status, which is what kube-proxy would use
    • public ips used for - 
      • binding to nodes / node
      • request a specific load balancer IP (GCE only)
      • emulate multi-port services -- now we support multi-port services, so no longer necessary
    • This is a large change, 70% code complete, Tim & Justin working together, parallel code review and updates, need to reconcile and test
    • Do we want to allow people to request host ports - is there any value in letting people ask for a public port? or should we assign you one?
      • Tim: we should assign one
    • discussion of what to do with status - if users set to empty then probably their intention
    • general answer to the pattern is binding
    • post v1: if we can make portal ip a non-user settable field, then we need to figure out the transition plan. need to have a fixed ip for dns.
    • we should be able to just randomly assign services a new port and everything should adjust, but this is not feasible for v1
    • next iteration of the proposal: PR is being iterated on, testing over the weekend, so PR hopefully ready early next week - gonna be a doozie!
  • API transition
    • actively removing all dependencies on v1beta1 and v1beta2, announced their going away
    • working on a script that will touch everything in the system and will force everything to flip to v1beta3
    • a release with both APIs supported and with this script can make sure clusters are moved over and we can move the API
    • Should be gone by 0.19
    • Help is welcome, especially for trivial things and will try to get as much done as possible in next few weeks
    • Release candidate targeting mid june
    • The new kubectl will not work for old APIs, will be a problem for GKE for clusters pinned to old version. Will be a problem for k8s users as well if they update kubectl
    • Since there’s no way to upgrade a GKE cluster, users are going to have to tear down and upgrade their cluster
    • we’re going to stop testing v1beta1 very soon, trying to streamline the testing paths in our CI pipelines
  • Did we decide we are not going to do namespace autoprovisioning?
    • Brian would like to turn it off - no objections
    • Documentation should include creating namepspaces
    • Would like to impose a default CPU for the default namespace
    • would cap the number of pods, would reduce the resource exhaustion issue
    • would eliminate need to explicitly cap the number of pods on a node due to IP exhaustion
    • could add resources as arguments to the porcelain commands
    • kubectl run is a simplified command, but it could include some common things (image, command, ports). but could add resources
  • Kubernetes 1.0 Launch Event
    • Save the date: July 21st in Portland, OR - a part of OSCON
    • Blog posts, whitepapers, etc. welcome to be published
    • Event will be live streamed, mostly demos & customer talks, keynote
    • Big launch party in the evening
    • Kit to send more info in next couple weeks

Kubernetes on OpenStack

$
0
0


Today, the OpenStack foundation made it even easier for you deploy and manage clusters of Docker containers on OpenStack clouds by including Kubernetes in its Community App Catalog.  At a keynote today at the OpenStack Summit in Vancouver, Mark Collier, COO of the OpenStack Foundation, and Craig Peters,  Mirantis product line manager, demonstrated the Community App Catalog workflow by launching a Kubernetes cluster in a matter of seconds by leveraging the compute, storage, networking and identity systems already present in an OpenStack cloud.


The entries in the catalog include not just the ability to start a Kubernetes cluster, but also a range of applications deployed in Docker containers managed by Kubernetes. These applications include:


  • Apache web server
  • Nginx web server
  • Crate - The Distributed Database for Docker
  • GlassFish - Java EE 7 Application Server
  • Tomcat - An open-source web server and servlet container
  • InfluxDB - An open-source, distributed, time series database
  • Grafana - Metrics dashboard for InfluxDB
  • Jenkins - An extensible open source continuous integration server
  • MariaDB database
  • MySql database
  • Redis - Key-value cache and store
  • PostgreSQL database
  • MongoDB NoSQL database
  • Zend Server - The Complete PHP Application Platform


This list will grow, and is curated here. You can examine (and contribute to) the YAML file that tells Murano how to install and start the Kubernetes cluster here.


The Kubernetes open source project has continued to see fantastic community adoption and increasing momentum, with over 11,000 commits and 7,648 stars on GitHub. With supporters ranging from Red Hat and Intel to CoreOS and Box.net, it has come to represent a range of customer interests ranging from enterprise IT to cutting edge startups. We encourage you to give it a try, give us your feedback, and get involved in our growing community.

- Martin Buhr, Product Manager, Kubernetes Open Source Project

Weekly Kubernetes Community Hangout Notes - May 22 2015

$
0
0
Every week the Kubernetes contributing community meet virtually over Google Hangouts. We want anyone who's interested to know what's discussed in this forum.


Discussion / Topics
  • Code Freeze
  • Upgrades of cluster
  • E2E test issues

Code Freeze process starts EOD 22-May, including
  • Code Slush -- draining PRs that are active. If there are issues for v1 to raise, please do so today.
    • Drain timeframe will be about 1-week.
  • Community PRs -- plan is to reopen in ~6 weeks.
  • Key areas for fixes in v1 -- docs, the experience.

E2E issues and LGTM process
  • Seen end-to-end tests go red.
  • Plan is to limit merging to on-call. Quinton to communicate.
    • Community committers, please label with LGTM and on-call will merge based on on-call’s judgement.
  • Can we expose Jenkins runs to community? (Paul)
    • Question/concern to work out is securing Jenkins. Short term conclusion: Will look at pushing Jenkins logs into GCS bucket. Lavalamp will follow up with Jeff Grafton.
    • Longer term solution may be a merge queue, where e2e runs for each merge (as opposed to multiple merges). This exists in Openshift today.

Cluster Upgrades for Kubernetes as final v1 feature
  • GCE will use Persistent Disk (PD) to mount new image.
  • OpenShift will follow a tradition update model, with “yum update”.
  • A strawman approach is to have an analog of “kube-push” to update the master, in-place. Feedback in the meeting was
    • Upgrading Docker daemon on the master will kill the master’s pods. Agreed. May consider an ‘upgrade’ phase or explicit step.
    • How is this different than HA master upgrade? See HA case as a superset. The work to do an upgrade would be a prerequisite for HA master upgrade.
  • Mesos scheduler implements a rolling node upgrade.

Attention requested for v1 in the Hangout
  • Downward plug-in #5093.
    • Discussed that it’s an eventually consistent design.
    • In the meeting, the outcome was: seeking a pattern for atomicity of update across multiple piece. Paul to ping Tim when ready to review.
  • Regression in e2e #8499 (Eric Paris)
  • Asking for review of direction, if not review. #8334 (Mark)
  • Handling graceful termination (e.g. sigterm to postgres) is not implemented. #2789 (Clayton)
    • Need is to bump up grace period or finish plumbing. In API, client tools, missing is kubelet does use and we don’t set the timeout (>0) value.
    • Brendan will look into this graceful term issue.
  • Load balancer almost ready by JustinSB.

Cluster Level Logging with Kubernetes

$
0
0

A Kubernetes cluster will typically be humming along running many system and application pods. How does the system administrator collect, manage and query the logs of the system pods? How does a user query the logs of their application which is composed of many pods which may be restarted or automatically generated by the Kubernetes system? These questions are addressed by the Kubernetes cluster level logging services.

Cluster level logging for Kubernetes allows us to collect logs which persist beyond the lifetime of the pod’s container images or the lifetime of the pod or even cluster. In this article we assume that a Kubernetes cluster has been created with cluster level logging support for sending logs to Google Cloud Logging. This is an option when creating a Google Container Engine (GKE) cluster, and is enabled by default for the open source Google Compute Engine (GCE) Kubernetes distribution. After a cluster has been created you will have a collection of system pods running that support monitoring, logging and DNS resolution for names of Kubernetes services:

$ kubectl get pods
NAME                                           READY     REASON    RESTARTS   AGE
fluentd-cloud-logging-kubernetes-minion-0f64   1/1       Running   0          32m
fluentd-cloud-logging-kubernetes-minion-27gf   1/1       Running   0          32m
fluentd-cloud-logging-kubernetes-minion-pk22   1/1       Running   0          31m
fluentd-cloud-logging-kubernetes-minion-20ej   1/1       Running   0          31m
kube-dns-v3-pk22                               3/3       Running   0          32m

monitoring-heapster-v1-20ej                    0/1       Running   9          32m

Here is the same information in a picture which shows how the pods might be placed on specific nodes.

cloud-logging.png

Here is a close up of what is running on each node.

0f64.png

27gf.png

pk22.png

20ej.png

The first diagram shows four nodes created on a GCE cluster with the name of each VM node on a purple background. The internal and public IPs of each node are shown on gray boxes and the pods running in each node are shown in green boxes. Each pod box shows the name of the pod and the namespace it runs in, the IP address of the pod and the images which are run as part of the pod’s execution. Here we see that every node is running a fluentd-cloud-logging pod which is collecting the log output of the containers running on the same node and sending them to Google Cloud Logging. A pod which provides a cluster DNS service runs on one of the nodes and a pod which provides monitoring support runs on another node.

To help explain how cluster level logging works let’s start off with a synthetic log generator pod specification counter-pod.yaml:


 apiVersion: v1
 kind: Pod
 metadata:
   name: counter
 spec:
   containers:
   - name: count
     image: ubuntu:14.04
     args: [bash, -c, 
            'for ((i = 0; ; i++)); do echo "$i: $(date)"; sleep 1; done']

This pod specification has one container which runs a bash script when the container is born. This script simply writes out the value of a counter and the date once per second and runs indefinitely. Let’s create the pod.

$ kubectl create -f counter-pod.yaml

pods/counter
We can observe the running pod:

$ kubectl get pods
NAME                                           READY     REASON    RESTARTS   AGE
counter                                        1/1       Running   0          5m
fluentd-cloud-logging-kubernetes-minion-0f64   1/1       Running   0          55m
fluentd-cloud-logging-kubernetes-minion-27gf   1/1       Running   0          55m
fluentd-cloud-logging-kubernetes-minion-pk22   1/1       Running   0          55m
fluentd-cloud-logging-kubernetes-minion-20ej   1/1       Running   0          55m
kube-dns-v3-pk22                               3/3       Running   0          55m
monitoring-heapster-v1-20ej                    0/1       Running   9          56m


This step may take a few minutes to download the ubuntu:14.04 image during which the pod status will be shown as Pending.

One of the nodes is now running the counter pod:

27gf-counter.png

When the pod status changes to Running we can use the kubectl logs command to view the output of this counter pod.

$ kubectl logs counter
0: Tue Jun  2 21:37:31 UTC 2015
1: Tue Jun  2 21:37:32 UTC 2015
2: Tue Jun  2 21:37:33 UTC 2015
3: Tue Jun  2 21:37:34 UTC 2015
4: Tue Jun  2 21:37:35 UTC 2015
5: Tue Jun  2 21:37:36 UTC 2015
...

This command fetches the log text from the Docker log file for the image that is running in this container. We can connect to the running container and observe the running counter bash script.

$ kubectl exec -i counter bash
ps aux
USER       PID %CPU %MEM    VSZ   RSS TTY      STAT START   TIME COMMAND
root         1  0.0  0.0  17976  2888 ?        Ss   00:02   0:00 bash -c for ((i = 0; ; i++)); do echo "$i: $(date)"; sleep 1; done
root       468  0.0  0.0  17968  2904 ?        Ss   00:05   0:00 bash
root       479  0.0  0.0   4348   812 ?        S    00:05   0:00 sleep 1
root       480  0.0  0.0  15572  2212 ?        R    00:05   0:00 ps aux

What happens if for any reason the image in this pod is killed off and then restarted by Kubernetes? Will we still see the log lines from the previous invocation of the container followed by the log lines for the started container? Or will we lose the log lines from the original container’s execution and only see the log lines for the new container? Let’s find out. First let’s stop the currently running counter.

$ kubectl stop pod counter
pods/counter

Now let’s restart the counter.

$ kubectl create -f counter-pod.yaml
pods/counter

Let’s wait for the container to restart and get the log lines again.

$ kubectl logs counter
0: Tue Jun  2 21:51:40 UTC 2015
1: Tue Jun  2 21:51:41 UTC 2015
2: Tue Jun  2 21:51:42 UTC 2015
3: Tue Jun  2 21:51:43 UTC 2015
4: Tue Jun  2 21:51:44 UTC 2015
5: Tue Jun  2 21:51:45 UTC 2015
6: Tue Jun  2 21:51:46 UTC 2015
7: Tue Jun  2 21:51:47 UTC 2015
8: Tue Jun  2 21:51:48 UTC 2015

Oh no! We’ve lost the log lines from the first invocation of the container in this pod! Ideally, we want to preserve all the log lines from each invocation of each container in the pod. Furthermore, even if the pod is restarted we would still like to preserve all the log lines that were ever emitted by the containers in the pod. But don’t fear, this is the functionality provided by cluster level logging in Kubernetes. When a cluster is created, the standard output and standard error output of each container can be ingested using a Fluentd agent running on each node into either Google Cloud Logging or into Elasticsearch and viewed with Kibana. This blog article focuses on Google Cloud Logging.

When a Kubernetes cluster is created with logging to Google Cloud Logging enabled, the system creates a pod called fluentd-cloud-logging on each node of the cluster to collect Docker container logs. These pods were shown at the start of this blog article in the response to the first get pods command.

This log collection pod has a specification which looks something like this fluentd-gcp.yaml:

apiVersion: v1
kind: Pod
metadata:
 name: fluentd-cloud-logging
spec:
 containers:
 - name: fluentd-cloud-logging
   image: gcr.io/google_containers/fluentd-gcp:1.6
   env:
   - name: FLUENTD_ARGS
     value: -qq
   volumeMounts:
   - name: containers
     mountPath: /var/lib/docker/containers
 volumes:
 - name: containers
   hostPath:
     path: /var/lib/docker/containers

This pod specification maps the the directory on the host containing the Docker log files, /var/lib/docker/containers, to a directory inside the container which has the same path. The pod runs one image, gcr.io/google_containers/fluentd-gcp:1.6, which is configured to collect the Docker log files from the logs directory and ingest them into Google Cloud Logging. One instance of this pod runs on each node of the cluster. Kubernetes will notice if this pod fails and automatically restart it.

We can click on the Logs item under the Monitoring section of the Google Developer Console and select the logs for the counter container, which will be called kubernetes.counter_default_count.  This identifies the name of the pod (counter), the namespace (default) and the name of the container (count) for which the log collection occurred. Using this name we can select just the logs for our counter container from the drop down menu:

counter-new-logs.png

When we view the logs in the Developer Console we observe the logs for both invocations of the container.

Screen Shot 2015-06-02 at 10.57.54 PM.png

Note the first container counted to 108 and then it was terminated. When the next container image restarted the counting process resumed from 0. Similarly if we deleted the pod and restarted it we would capture the logs for all instances of the containers in the pod whenever the pod was running.


Logs ingested into Google Cloud Logging may be exported to various other destinations includingGoogle Cloud Storagebuckets and BigQuery. Use the Exports tab in the Cloud Logging console to specify where logs should be streamed to (or follow this link to the settings tab).


We could query the ingested logs from BigQuery using the SQL query which reports the counter log lines showing the newest lines first.


SELECT metadata.timestamp, structPayload.log FROM [mylogs.kubernetes_counter_default_count_20150611] ORDERBY metadata.timestamp DESC


Here is some sample output:


bigquery-log-new.png

We could also fetch the logs from Google Cloud Storage buckets to our desktop or laptop and then search them locally. The following command fetches logs for the counter pod running in a cluster which is itself in a GCE project called myproject. Only logs for the date 2015-06-11 are fetched.


$ gsutil -m cp -r gs://myproject/kubernetes.counter_default_count/2015/06/11 .

Now we can run queries over the ingested logs. The example below uses the jq program to extract just the log lines.


$ cat 21\:00\:00_21\:59\:59_S0.json | jq '.structPayload.log'
"0: Thu Jun 11 21:39:38 UTC 2015\n"
"1: Thu Jun 11 21:39:39 UTC 2015\n"
"2: Thu Jun 11 21:39:40 UTC 2015\n"
"3: Thu Jun 11 21:39:41 UTC 2015\n"
"4: Thu Jun 11 21:39:42 UTC 2015\n"
"5: Thu Jun 11 21:39:43 UTC 2015\n"
"6: Thu Jun 11 21:39:44 UTC 2015\n"
"7: Thu Jun 11 21:39:45 UTC 2015\n"
...

This article has touched briefly on the underlying mechanisms that support gathering cluster level logs on a Kubernetes deployment. The approach here only works for gathering the standard output and standard error output of the processes running in the pod’s containers. To gather other logs that are stored in files one can use a sidecar container to gather the required files as described at the page Collecting log files within containers with Fluentd and sending them to the Google Cloud Logging service.

Using Kubernetes Namespaces to Manage Environments

$
0
0

One of the advantages that Kubernetes provides is the ability to manage various environments easier and better than traditional deployment strategies. For most nontrivial applications, you have test, staging, and production environments. You can spin up a separate cluster of resources, such as VMs, with the same configuration in staging and production, but that can be costly and managing the differences between the environments can be difficult.

Kubernetes includes a cool feature called namespaces, which enable you to manage different environments within the same cluster. For example, you can have different test and staging environments in the same cluster of machines, potentially saving resources. You can also run different types of server, batch, or other jobs in the same cluster without worrying about them affecting each other.

The Default Namespace

Specifying the namespace is optional in Kubernetes because by default Kubernetes uses the "default" namespace. If you've just created a cluster, you can check that the default namespace exists using this command:
$ kubectl get namespaces
NAME          LABELS    STATUS
default       <none>    Active
kube-system   <none>    Active


Here you can see that the default namespace exists and is active. The status of the namespace is used later when turning down and deleting the namespace.

Creating a New Namespace

You create a namespace in the same way you would any other resource. Create a my-namespace.yaml file and add these contents:
kind: Namespace
apiVersion: v1
metadata:
 name: my-namespace
 labels:
   name: my-namespace

Then you can run this command to create it:
$ kubectl create -f my-namespace.yaml

Service Names

With namespaces you can have your apps point to static service endpoints that don't change based on the environment. For instance, your MySQL database service could be named mysql in production and staging even though it runs on the same infrastructure.
This works because each of the resources in the cluster will by default only "see" the other resources in the same namespace. This means that you can avoid naming collisions by creating pods, services, and replication controllers with the same names provided they are in separate namespaces. Within a namespace, short DNS names of services resolve to the IP of the service within that namespace. So for example, you might have an Elasticsearch service that can be accessed via the DNS name elasticsearch as long as the containers accessing it are located in the same namespace.
You can still access services in other namespaces by looking it up via the full DNS name which takes the form of SERVICE-NAME.NAMESPACE-NAME. So for example, elasticsearch.prod or elasticsearch.canary for the production and canary environments respectively.

An Example

Lets look at an example application. Let’s say you want to deploy your music store service MyTunes in Kubernetes. You can run the application production and staging environment as well as some one-off apps running in the same cluster. You can get a better idea of what’s going on by running some commands:
~$ kubectl get namespaces
NAME                    LABELS    STATUS
default                 <none>    Active
mytunes-prod            <none>    Active
mytunes-staging         <none>    Active
my-other-app            <none>    Active

Here you can see a few namespaces running. Next let’s list the services in staging:
~$ kubectl get services --namespace=mytunes-staging
NAME          LABELS                    SELECTOR        IP(S)             PORT(S)
mytunes       name=mytunes,version=1    name=mytunes    10.43.250.14      80/TCP
                                                       104.185.824.125   
mysql         name=mysql                name=mysql      10.43.250.63      3306/TCP

Next check production:
~$ kubectl get services --namespace=mytunes-prod
NAME          LABELS                    SELECTOR        IP(S)             PORT(S)
mytunes       name=mytunes,version=1    name=mytunes    10.43.241.145     80/TCP
                                                       104.199.132.213   
mysql         name=mysql                name=mysql      10.43.245.77      3306/TCP

Notice that the IP addresses are different depending on which namespace is used even though the names of the services themselves are the same. This capability makes configuring your app extremely easy—since you only have to point your app at the service name—and has the potential to allow you to configure your app exactly the same in your staging or test environments as you do in production.

Caveats

While you can run staging and production environments in the same cluster and save resources and money by doing so, you will need to be careful to set up resource limits so that your staging environment doesn't starve production for CPU, memory, or disk resources. Setting resource limits properly, and testing that they are working takes a lot of time and effort so unless you can measurably save money by running production in the same cluster as staging or test, you may not really want to do that.
Whether or not you run staging and production in the same cluster, namespaces are a great way to partition different apps within the same cluster. Namespaces will also serve as a level where you can apply resource limits so look for more resource management features at the namespace level in the future.
- Posted by Ian Lewis, Developer Advocate at Google

Kubernetes Performance Measurements and Roadmap

$
0
0
No matter how flexible and reliable your container orchestration system is, ultimately, you have some work to be done, and you want it completed quickly. For big problems, a common answer is to just throw more machines at the problem. After all, more compute = faster, right?


Interestingly, adding more nodes is a little like the tyranny of the rocket equation - in some systems, adding more machines can actually make your processing slower. However, unlike the rocket equation, we can do better. Kubernetes in v1.0 version supports clusters with up to 100 nodes. However, we have a goal to 10x the number of nodes we will support by the end of 2015. This blog post will cover where we are and how we intend to achieve the next level of performance.


What do we measure?
The first question we need to answer is: “what does it mean that Kubernetes can manage an N-node cluster?” Users expect that it will handle all operations “reasonably quickly,” but we need a precise definition of that. We decided to define performance and scalability goals based on the following two metrics:
  1. “API-responsiveness”*: 99% of all our API calls return in less than 1 second
  2. “Pod startup time”: 99% of pods (with pre-pulled images) start within 5 seconds


Note that for “pod startup time” we explicitly assume that all images necessary to run a pod are already pre-pulled on the machine where it will be running. In our experiments, there is a high degree of variability (network throughput, size of image, etc) between images, and these variations have little to do with Kubernetes’ overall performance.


The decision to choose those metrics was made based on our experience spinning up 2 billion containers a week at Google. We explicitly want to measure the latency of user-facing flows since that’s what customers will actually care about.


How do we measure?
To monitor performance improvements and detect regressions we set up a continuous testing infrastructure. Every 2-3 hours we create a 100-node cluster from HEAD and run our scalability tests on it. We use a GCE n1-standard-4 (4 cores, 15GB of RAM) machine as a master and n1-standard-1 (1 core, 3.75GB of RAM) machines for nodes.


In scalability tests, we explicitly focus only on the full-cluster case (full N-node cluster is a cluster with 30 * N pods running in it) which is the most demanding scenario from a  performance point of view. To reproduce what a customer might actually do, we run through the following steps:
  1. Populate pods and replication controllers to fill the cluster
  2. Generate some load (create/delete additional pods and/or replication controllers, scale the existing ones, etc.) and record performance metrics
  3. Stop all running pods and replication controllers
  4. Scrape the metrics and check whether they match our expectations


It is worth emphasizing that the main parts of the test are done on full clusters (30 pods per node, 100 nodes) - starting a pod in an empty cluster, even if it has 100 nodes will be much faster.


To measure pod startup latency we are using very simple pods with just a single container running the “gcr.io/google_containers/pause:go” image, which starts and then sleeps forever. The container is guaranteed to be already pre-pulled on nodes (we use it as the so-called pod-infra-container).


Performance data
The following table contains percentiles (50th, 90th and 99th) of pod startup time in 100-node clusters which are 10%, 25%, 50% and 100% full.


10%-full
25%-full
50%-full
100%-full
50th percentile
0.90s
1.08s
1.33s
1.94s
90th percentile
1.29s
1.49s
1.72s
2.50s
99th percentile
1.59s
1.86s
2.56s
4.32s


As for api-responsiveness, the following graphs present 50th, 90th and 99th percentiles of latencies of API calls grouped by kind of operation and resource type. However, note that this also includes internal system API calls, not just those issued by users (in this case issued by the test itself).

get.pngput.png

delete.pngpost.png
list.png


Some resources only appear on certain graphs, based on what was running during that operation (e.g. no namespace was put at that time).


As you can see in the results, we are ahead of target for our 100-node cluster with pod startup time even in a fully-packed cluster occurring 14% faster in the 99th percentile than 5 seconds. It’s interesting to point out that  LISTing pods is significantly slower than any other operation. This makes sense: in a full cluster there are 3000 pods and each of pod is roughly few kilobytes of data, meaning megabytes of data that need to processed for each LIST.


Work done and some future plans
The initial performance work to make 100-node clusters stable enough to run any tests on them involved a lot of small fixes and tuning, including increasing the limit for file descriptors in the apiserver and reusing tcp connections between different requests to etcd.


However, building a stable performance test was just step one to increasing the number of nodes our cluster supports by tenfold. As a result of this work, we have already taken on significant effort to remove future bottlenecks, including:
  1. Rewriting controllers to be watch-based: Previously they were relisting objects of a given type every few seconds, which generated a huge load on the apiserver.
  2. Using code generators to produce conversions and deep-copy functions: Although the default implementation using Go reflections are very convenient, they proved to be extremely slow, as much as 10X in comparison to the generated code.
  3. Adding a cache to apiserver to avoid deserialization of the same data read from etcd multiple times
  4. Reducing frequency of updating statuses: Given the slow changing nature of statutes, it only makes sense to update pod status only on change and node status only every 10 seconds.
  5. Implemented watch at the apiserver instead of redirecting the requests to etcd: We would prefer to avoid watching for the same data from etcd multiple times, since, in many cases, it was filtered out in apiserver anyway.


Looking further out to our 1000-node cluster goal, proposed improvements include:
  1. Moving events out from etcd: They are more like system logs and are neither part of system state nor are crucial for Kubernetes to work correctly.
  2. Using better json parsers: The default parser implemented in Go is very slow as it is based on reflection.
  3. Rewriting the scheduler to make it more efficient and concurrent
  4. Improving efficiency of communication between apiserver and Kubelets: In particular, we plan to reduce the size of data being sent on every update of node status.


This is by no means an exhaustive list. We will be adding new elements (or removing existing ones) based on the observed bottlenecks while running the existing scalability tests and newly-created ones. If there are particular use cases or scenarios that you’d like to see us address, please join in!


* It should be noted that we exclude all operations for “events” resource from API responsiveness metrics and we don’t provide any guarantees for them since these do not affect the ability of Kubernetes to operate properly (they are more like system logs).

- Wojciech Tyczynski, Google Software Engineer

Some things you didn’t know about kubectl

$
0
0
kubectl is the command line tool for interacting with Kubernetes clusters. Many people use it every day to deploy their container workloads into production clusters. But there’s more to kubectl than just kubectl create -f or kubectl rolling-update. kubectl is a veritable multi-tool of container orchestration and management. Below we describe some of the features of kubectl that you may not have seen. 

Important Note: Most of these features are part of the upcoming 1.1 release of Kubernetes. They are not present in the current stable 1.0.x release series.

Run interactive commands 


kubectl run has been in kubectl since the 1.0 release, but recently we added the ability to run interactive containers in your cluster. That means that an interactive shell in your Kubernetes cluster is as close as:

$> kubectl run -i --tty busybox --image=busybox --restart=Never -- sh 
Waiting for pod default/busybox-tv9rm to be running, status is Pending, pod ready: false 
Waiting for pod default/busybox-tv9rm to be running, status is Running, pod ready: false 

$> # ls 
bin dev etc home proc root sys tmp usr var 
$> # exit

The above kubectl command is equivalent to docker run -i -t busybox sh. Sadly we mistakenly used -t for template in kubectl 1.0, so we need to retain backwards compatibility with existing CLI user. But the existing use of -t is deprecated and we’ll eventually shorten --tty to -t.

In this example, -i indicates that you want an allocated stdin for your container and indicates that you want an interactive session, --restart=Never indicates that the container shouldn’t be restarted after you exit the terminal and --tty requests that you allocate a TTY for that session.

View your Pod’s logs 


Sometimes you just want to watch what’s going on in your server. For this, kubectl logs is the subcommand to use. Adding the -f flag lets you live stream new logs to your terminal, just like tail -f.

$> kubectl logs -f redis-izl09

Attach to existing containers


In addition to interactive execution of commands, you can now also attach to any running process. Like kubectl logs, you’ll get stderr and stdout data, but with attach, you’ll also be able to send stdin from your terminal to the program. Awesome for interactive debugging, or even just sending ctrl-c to a misbehaving application.
$> kubectl attach redis -i
1:C 12 Oct 23:05:11.848 # Warning: no config file specified, using the default config. In order to specify a config file use redis-server /path/to/redis.conf
_._
_.-``__ ''-._
_.-`` `. `_. ''-._ Redis 3.0.3 (00000000/0) 64 bit
.-`` .-```. ```\/ _.,_ ''-._
( ' , .-` | `, ) Running in standalone mode
|`-._`-...-` __...-.``-._|'` _.-'| Port: 6379
| `-._ `._ / _.-' | PID: 1
`-._ `-._ `-./ _.-' _.-'
|`-._`-._ `-.__.-' _.-'_.-'|
| `-._`-._ _.-'_.-' | http://redis.io
`-._ `-._`-.__.-'_.-' _.-'
|`-._`-._ `-.__.-' _.-'_.-'|
| `-._`-._ _.-'_.-' |
`-._ `-._`-.__.-'_.-' _.-'
`-._ `-.__.-' _.-'
`-._ _.-'
`-.__.-'

1:M 12 Oct 23:05:11.849 # Server started, Redis version 3.0.3

Forward ports from Pods to your local machine 


Often times you want to be able to temporarily communicate with applications in your cluster without exposing them to the public internet for security reasons. To achieve this, the port-forward command allows you to securely forward a port on your local machine through the kubernetes API server to a Pod running in your cluster. For example:

$> kubectl port-forward redis-izl09 6379

Opens port 6379 on your local machine and forwards communication to that port to the Pod or Service in your cluster. For example, you can use the ‘telnet’ command to poke at a Redis service in your cluster:

$> telnet localhost 6379 
INCR foo 
:1 
INCR foo 
:2


Execute commands inside an existing container

In addition to being able to attach to existing processes inside a container, the “exec” command allows you to spawn new processes inside existing containers. This can be useful for debugging, or examining your pods to see what’s going on inside without interrupting a running service. kubectl exec is different from kubectl run, because it runs a command inside of an existing container, rather than spawning a new container for execution.

$> kubectl exec redis-izl09 -- ls /
bin
boot
data
dev
entrypoint.sh
etc
home


Add or remove Labels 


Sometimes you want to dynamically add or remove labels from a Pod, Service or Replication controller. Maybe you want to add an existing Pod to a Service, or you want to remove a Pod from a Service. No matter what you want, you can easily and dynamically add or remove labels using the kubectl label subcommand:

$> kubectl label pods redis-izl09 mylabel=awesome 
pod "redis-izl09" labeled

Add annotations to your objects 


Just like labels, you can add or remove annotations from API objects using the kubectl annotate subcommand. Unlike labels, annotations are there to help describe your object, but aren’t used to identify pods via label queries (more details on annotations). For example, you might add an annotation of an icon for a GUI to use for displaying your pods.

$> kubectl annotate pods redis-izl09 icon-url=http://goo.gl/XXBTWq 
pod "redis-izl09" annotated

Output custom format 


Sometimes, you want to customize the fields displayed when kubectl summarizes an object from your cluster. To do this, you can use the custom-columns-file format. custom-columns-file takes in a template file for rendering the output. Again, JSONPath expressions are used in the template to specify fields in the API object. For example, the following template first shows the number of restarts, and then the name of the object:

$> cat cols.tmpl 
RESTARTS                                   NAME 
.status.containerStatuses[0].restartCount .metadata.name

If you pass this template to the `kubectl get pods` command you get a list of pods with the specified fields displayed.

 $> kubectl get pods redis-izl09 -o=custom-columns-file --template=cols.tmpl                 RESTARTS           NAME 
 0                  redis-izl09 
 1                  redis-abl42

Easily manage multiple Kubernetes clusters


If you’re running multiple Kubernetes clusters, you know it can be tricky to manage all of the credentials for the different clusters. Using the kubectl config subcommands, switching between different clusters is as easy as:

$> kubectl config use-context 

Not sure what clusters are available? You can view currently configured clusters with:

$> kubectl config view

Phew, that outputs a lot of text. To restrict it down to only the things we’re interested in, we can use a JSONPath template:

$> kubectl config view -o jsonpath=’{.context[*].name}’ Ahh, that’s better.

Conclusion 


So there you have it, nine new and exciting things you can do with your Kubernetes cluster and the kubectl command line. If you’re just getting started with Kubernetes, check out Google Container Engine or other ways to get started with Kubernetes.

- Brendan Burns, Google Software Engineer

Kubernetes as Foundation for Cloud Native PaaS

$
0
0
With Kubernetes continuing to gain momentum as a critical tool for building and scaling container based applications, we’ve been thrilled to see a growing number of platform as a service (PaaS) offerings adopt it as a foundation. PaaS developers have been drawn to Kubernetes by its rapid rate of maturation, the soundness of its core architectural concepts, and the strength of its contributor community. The Kubernetes ecosystem continues to grow, and these PaaS projects are great additions to it.


Deis is the leading Docker PaaS with over a million downloads, actively used by companies like Mozilla, The RealReal, ShopKeep and Coinbase. Deis provides software teams with a turn-key platform for running containers in production, featuring the ability to build and store Docker images, production-grade load balancing, a streamlined developer interface and an ops-ready suite of logging and monitoring infrastructure backed by world-class 24x7x365 support. After a community-led evaluation of alternative orchestrators, it was clear that Kubernetes represents a decade of experience running containers at scale inside Google. The Deis project is proud to be rebasing onto Kubernetes and is thrilled to join its vibrant community." - Gabriel Monroy, CTO of Engine Yard, Inc.


OpenShift by Red Hat helps organizations accelerate application delivery by enabling development and IT operations teams to be more agile, responsive and efficient. OpenShift Enterprise 3 is the first fully supported, enterprise-ready, web-scale container application platform that natively integrates the Docker container runtime and packaging format, Kubernetes container orchestration and management engine, on a foundation of Red Hat Enterprise Linux 7, all fully supported by Red Hat from the operating system to application runtimes.

“Kubernetes provides OpenShift users with a powerful model for application orchestration, leveraging concepts like pods and services, to deploy (micro)services that inherently span multiple containers and application topologies that will require wiring together multiple services. Pods can be optionally mapped to storage, which means you can run both stateful and stateless services in OpenShift. Kubernetes also provides a powerful declarative management model to manage the lifecycle of application containers. Customers can then use Kubernetes’ integrated scheduler to deploy and manage containers across multiple hosts. As a leading contributor to both the Docker and Kubernetes open source projects, Red Hat is not just adopting these technologies but actively building them upstream in the community.”  - Joe Fernandes, Director of Product Management for Red Hat OpenShift.


Huawei, a leading global ICT technology solution provider, will offer container as a service (CaaS) built on Kubernetes in the public cloud for customers with Docker based applications. Huawei CaaS services will manage multiple clusters across data centers, and deploy, monitor and scale containers with high availability and high resource utilization for their customers. For example, one of Huawei’s current software products for their telecom customers utilizes tens of thousands of modules and hundreds of instances in virtual machines. By moving to a container based PaaS platform powered by Kubernetes, Huawei is migrating this product into a micro-service based, cloud native architecture. By decoupling the modules, they’re creating a high performance, scalable solution that runs hundreds, even thousands of containers in the system. Decoupling existing heavy modules could have been a painful exercise. However, using several key concepts introduced by Kubernetes, such as pods, services, labels, and proxies, Huawei has been able to re-architect their software with great ease.

Huawei has made Kubernetes the core runtime engine for container based applications/services, and they’ve been building other PaaS components or capabilities around Kubernetes, such as user access management, composite API, Portal and multiple cluster management. Additionally, as part of the migration to the new platform, they’re enhancing their PaaS solution in the areas of advanced scheduling algorithm, multi tenant support and enhanced container network communication to support customer needs.

“Huawei chose Kubernetes as the foundation for our offering because we like the abstract concepts of services, pod and label for modeling and distributed applications. We developed an application model based on these concepts to model existing complex applications which works well for moving legacy applications into the cloud. In addition, Huawei intends for our PaaS platform to support many scenarios, and Kubernetes’ flexible architecture with its plug-in capability is key to our platform architecture.”- Ying Xiong, Chief Architect of PaaS at Huawei.


Gondor is a PaaS with a focus on application hosting throughout the lifecycle, from development to testing to staging to production. It supports Python, Go, and Node.js applications as well as technologies such as Postgres, Redis and Elasticsearch. The Gondor team recently re-architected Gondor to incorporate Kubernetes, and discussed this in a blog post.

“There are two main reasons for our move to Kubernetes: One, by taking care of the lower layers in a truly scalable fashion, Kubernetes lets us focus on providing a great product at the application layer. Two, the portability of Kubernetes allows us to expand our PaaS offering to on-premises, private cloud and a multitude of alternative infrastructure providers.” - Brian Rosner, Chief Architect at Eldarion (the driving force behind Gondor)
- Martin Buhr, Google Business Product Manager

Kubernetes 1.1 Performance upgrades, improved tooling and a growing community

$
0
0
Since the Kubernetes 1.0 release in July, we’ve seen tremendous adoption by companies building distributed systems to manage their container clusters. We’re also been humbled by the rapid growth of the community who help make Kubernetes better everyday. We have seen commercial offerings such as Tectonic by CoreOS and RedHat Atomic Host emerge to deliver deployment and support of Kubernetes. And a growing ecosystem has added Kubernetes support including tool vendors such as Sysdig and Project Calico.

With the help of hundreds of contributors, we’re proud to announce the availability of Kubernetes 1.1, which offers major performance upgrades, improved tooling, and new features that make applications even easier to build and deploy.

Some of the work we’d like to highlight includes:

  • Substantial performance improvements: We have architected Kubernetes from day one to handle Google-scale workloads, and our customers have put it through their paces. In Kubernetes 1.1, we have made further investments to ensure that you can run in extremely high-scale environments; later this week, we will be sharing examples of running thousand node clusters, and running over a million QPS against a single cluster. 
  • Significant improvement in network throughput: Running Google-scale workloads also requires Google-scale networking. In Kubernetes 1.1, we have included an option to use native IP tables offering an 80% reduction in tail latency, an almost complete elimination of CPU overhead and improvements in reliability and system architecture ensuring Kubernetes can handle high-scale throughput well into the future. 
  • Horizontal pod autoscaling (Beta): Many workloads can go through spiky periods of utilization, resulting in uneven experiences for your users. Kubernetes now has support for horizontal pod autoscaling, meaning your pods can scale up and down based on CPU usage. Read more about Horizontal pod autoscaling
  • HTTP load balancer (Beta): Kubernetes now has the built-in ability to route HTTP traffic based on the packets introspection. This means you can have ‘http://foo.com/bar’ go to one service, and ‘http://foo.com/meep’ go to a completely independent service. Read more about the Ingress object
  • Job objects (Beta): We’ve also had frequent request for integrated batch jobs, such as processing a batch of images to create thumbnails or a particularly large data file that has been broken down into many chunks. Job objects introduces a new API object that runs a workload, restarts it if it fails, and keeps trying until it’s successfully completed. Read more about the Job object
  • New features to shorten the test cycle for developers: We continue to work on making developing for applications for Kubernetes quick and easy. Two new features that speeds developer’s workflows include the ability to run containers interactively, and improved schema validation to let you know if there are any issues with your configuration files before you deploy them. 
  • Rolling update improvements: Core to the DevOps movement is being able to release new updates without any affect on a running service. Rolling updates now ensure that updated pods are healthy before continuing the update. 
  • And many more. For a complete list of updates, see the 1.1. release notes on GitHub 

Today, we’re also proud to mark the inaugural Kubernetes conference, KubeCon, where some 400 community members along with dozens of vendors are in attendance supporting the Kubernetes project.

We’d love to highlight just a few of the many partners making Kubernetes better:
“We are betting our major product, Tectonic – which enables any company to deploy, manage and secure its containers anywhere – on Kubernetes because we believe it is the future of the data center. The release of Kubernetes 1.1 is another major milestone that will create more widespread adoption of distributed systems and containers, and puts us on a path that will inevitably lead to a whole new generation of products and services.” – Alex Polvi, CEO, CoreOS.
“Univa’s customers are looking for scalable, enterprise-caliber solutions to simplify managing container and non-container workloads in the enterprise. We selected Kubernetes as a foundational element of our new Navops suite which will help IT and DevOps rapidly integrate containerized workloads into their production systems and extend these workloads into cloud services.” – Gary Tyreman, CEO, Univa.
“The tremendous customer demand we’re seeing to run containers at scale with Kubernetes is a critical element driving growth in our professional services business at Redapt. As a trusted advisor, it’s great to have a tool like Kubernetes in our tool belt to help our customers achieve their objectives.” – Paul Welch, SR VP Cloud Solutions, Redapt
As we mentioned above, we would love your help:
  • Get involved with the Kubernetes project on GitHub 
  • Connect with the community on Slack
  • Follow us on Twitter @Kubernetesio for latest updates 
  • Post questions (or answer questions) on Stackoverflow 
  • Get started running, deploying, and using Kubernetes guides 

But, most of all, just let us know how you are transforming your business using Kubernetes, and how we can help you do it even faster. Thank you for your support!

 - David Aronchick, Senior Product Manager for Kubernetes and Google Container Engine

One million requests per second: Dependable and dynamic distributed systems at scale

$
0
0
Recently, I’ve gotten in the habit of telling people that building a reliable service isn’t that hard. If you give me two Compute Engine virtual machines, a Cloud Load balancer, supervisord and nginx, I can create you a static web service that will serve a static web page, effectively forever.

The real challenge is building agile AND reliable services. In the new world of software development it's trivial to spin up enormous numbers of machines and push software to them. Developing a successful product must also include the ability to respond to changes in a predictable way, to handle upgrades elegantly and to minimize downtime for users. Missing on any one of these elements results in an unsuccessful product that's flaky and unreliable. I remember a time, not that long ago, when it was common for websites to be unavailable for an hour around midnight each day as a safety window for software upgrades. My bank still does this. It’s really not cool.

Fortunately, for developers, our infrastructure is evolving along with the requirements that we’re placing on it. Kubernetes has been designed from the ground up to make it easy to design, develop and deploy dependable, dynamic services that meet the demanding requirements of the cloud native world.

To demonstrate exactly what we mean by this, I've developed a simple demo of a Container Engine cluster serving 1 million HTTP requests per second. In all honesty, serving 1 million requests per second isn’t really that exciting. In fact, it’s really so very 2013.


What is exciting is that while successfully handling 1 million HTTP requests per second with uninterrupted availability, we have Kubernetes perform a zero-downtime rolling upgrade of the service to a new version of the software while we're still serving 1 million requests per second.


This is only possible due to a large number of performance tweaks and enhancements that have gone into the Kubernetes 1.1 release. I’m incredibly proud of all of the features that our community has built into this release. Indeed in addition to making it possible to serve 1 million requests per second, we’ve also added an auto-scaler, so that you won’t even have to wake up in the middle of the night to scale your service in response to load or memory pressures.

If you want to try this out on your own cluster (or use the load test framework to test your own service) the code for the demo is available on github. And the full video is available.

I hope I’ve shown you how Kubernetes can enable developers of distributed systems to achieve both reliability and agility at scale, and as always, if you’re interested in learning more, head over to kubernetes.io or github and connect with the community on our Slack channel. 

-

- Brendan Burns, Senior Staff Software Engineer, Google, Inc.

Monitoring Kubernetes with Sysdig

$
0
0
Today we’re sharing a guest post by Chris Crane from Sysdig about their monitoring integration into Kubernetes. 

Kubernetes offers a full environment to write scalable and service-based applications. It takes care of things like container grouping, discovery, load balancing and healing so you don’t have to worry about them. The design is elegant, scalable and the APIs are a pleasure to use.

And like any new infrastructure platform, if you want to run Kubernetes in production, you’re going to want to be able to monitor and troubleshoot it. We’re big fans of Kubernetes here at Sysdig, and, well: we’re here to help.

Sysdig offers native visibility into Kubernetes across the full Sysdig product line. That includes sysdig, our open source, CLI system exploration tool, and Sysdig Cloud, the first and only monitoring platform designed from the ground up to support containers and microservices.

At a high level, Sysdig products are aware of the entire Kubernetes cluster hierarchy, including namespaces, services, replication controllers and labels. So all of the rich system and application data gathered is now available in the context of your Kubernetes infrastructure. What does this mean for you? In a nutshell, we believe Sysdig can be your go-to tool for making Kubernetes environments significantly easier to monitor and troubleshoot!

In this post I will quickly preview the Kubernetes visibility in both open source sysdig and Sysdig Cloud, and show off a couple interesting use cases. Let’s start with the open source solution.

Exploring a Kubernetes Cluster with csysdig 


The easiest way to take advantage of sysdig’s Kubernetes support is by launching csysdig, the sysdig ncurses UI:

 > csysdig -k http://127.0.0.1:8080 

Note: specify the address of your Kubernetes API server with the -k command, and sysdig will poll all the relevant information, leveraging both the standard and the watch API.

Now that csysdig is running, hit F2 to bring up the views panel, and you'll notice the presence of a bunch of new views. The k8s Namespaces view can be used to see the list of namespaces and observe the amount of CPU, memory, network and disk resources each of them is using on this machine:


Similarly, you can select k8s Services to see the same information broken up by service:


or k8s Controllers to see the replication controllers:


or k8s Pods to see the list of pods running on this machine and the resources they use:


Drill Down-Based Navigation 

A cool feature in csysdig is the ability to drill down: just select an element, click on enter and  boom  now you're looking inside it. Drill down is also aware of the Kubernetes hierarchy, which means I can start from a service, get the list of its pods, see which containers run inside one of the pods, and go inside one of the containers to explore files, network connections, processes or even threads. Check out the video below.


Actions! 

One more thing about csysdig. As recently announced, csysdig also offers “control panel” functionality, making it possible to use hotkeys to execute command lines based on the element currently selected. So we made sure to enrich the Kubernetes views with a bunch of useful hotkeys. For example, you can delete a namespace or a service by pressing "x," or you can describe them by pressing "d."

My favorite hotkeys, however, are "f," to follow the logs that a pod is generating, and "b," which leverages kubectl exec to give you a shell inside a pod. Being brought into a bash prompt for the pod you’re observing is really useful and, frankly, a bit magic. :-)

So that’s a quick preview of Kubernetes in sysdig. Note though, that all of this functionality is only for a single machine. What happens if you want to monitor a distributed Kubernetes cluster? Enter Sysdig Cloud.

Monitoring Kubernetes with Sysdig Cloud 

Let’s start with a quick review of Kubernetes’ architecture. From the physical/infrastructure point of view, a Kubernetes cluster is made up of a set of minion machines overseen by a master machine. The master’s tasks include orchestrating containers across minions, keeping track of state and exposing cluster control through a REST API and a UI.

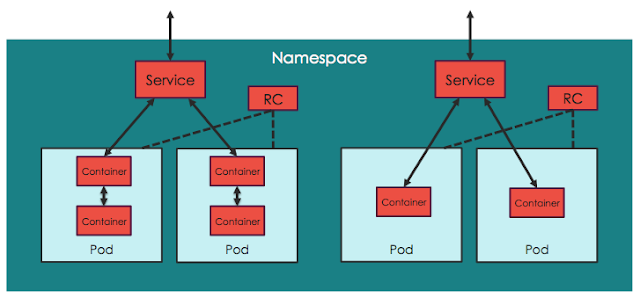
On the other hand, from the logical/application point of view, Kubernetes clusters are arranged in the hierarchical fashion shown in this picture:


  • All containers run inside pods. A pod can host a single container, or multiple cooperating containers; in the latter case, the containers in the pod are guaranteed to be co-located on the same machine and can share resources. 
  • Pods typically sit behind services, which take care of balancing the traffic, and also expose the set of pods as a single discoverable IP address/port. 
  • Services are scaled horizontally by replication controllers (“RCs”) which create/destroy pods for each service as needed. 
  • Namespaces are virtual clusters that can include one or more services. 

So just to be clear, multiple services and even multiple namespaces can be scattered across the same physical infrastructure.

After talking to hundreds of Kubernetes users, it seems that the typical cluster administrator is often interested in looking at things from the physical point of view, while service/application developers tend to be more interested in seeing things from the logical point of view. 

With both these use cases in mind, Sysdig Cloud’s support for Kubernetes works like this: 
  1. By automatically connecting to a Kubernetes’ cluster API Server and querying the API (both the regular and the watch API), Sysdig Cloud is able to infer both the physical and the logical structure of your microservice application. 
  2. In addition, we transparently extract important metadata such as labels. 
  3. This information is combined with our patent-pending ContainerVision technology, which makes it possible to inspect applications running inside containers without requiring any instrumentation of the container or application. 
Based on this, Sysdig Cloud can provide rich visibility and context from both an infrastructure-centric and an application-centric point of view. Best of both worlds! Let’s check out what this actually looks like.

One of the core features of Sysdig Cloud is groups, which allow you to define the hierarchy of metadata for your applications and infrastructure. By applying the proper groups, you can explore your containers based on their physical hierarchy (for example, physical cluster > minion machine > pod > container) or based on their logical microservice hierarchy (for example, namespace > replication controller > pod > container as you can see in this example). 

If you’re interested in the utilization of your underlying physical resource e.g., identifying noisy neighbors then the physical hierarchy is great. But if you’re looking to explore the performance of your applications and microservices, then the logical hierarchy is often the best place to start. 


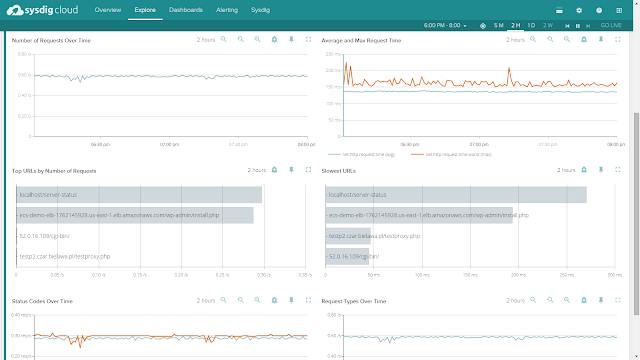
For example: here you can see the overall performance of our WordPress service: 


Keep in mind that the pods implementing this service are scattered across multiple machines, but we can still total request counts, response times and URL statistics aggregated together for this service. And don’t forget: this doesn’t require any configuration or instrumentation of wordpress, apache, or the underlying containers! 

And from this view, I can now easily create alerts for these service-level metrics, and I can dig down into any individual container for deep inspection - down to the process level   whenever I want, including back in time! 

Visualizing Your Kubernetes Services 

We’ve also included Kubernetes awareness in Sysdig Cloud’s famous topology view, at both the physical and logical level. 


The two pictures below show the exact same infrastructure and services. But the first one depicts the physical hierarchy, with a master node and three minion nodes; while the second one groups containers into namespaces, services and pods, while abstracting the physical location of the containers. 

Hopefuly it’s self-evident how much more natural and intuitive the second (services-oriented) view is. The structure of the application and the various dependencies are immediately clear. The interactions between various microservices become obvious, despite the fact that these microservices are intermingled across our machine cluster! 

Conclusion 

I’m pretty confident that what we’re delivering here represents a huge leap in visibility into Kubernetes environments and it won’t disappoint you. I also hope it can be a useful tool enabling you to use Kubernetes in production with a little more peace of mind. Thanks, and happy digging! 

- Chris Crane, VP Product, Sysdig 

You can find open source sysdig on github and at sysdig.org, and you can sign up for free trial of Sysdig Cloud at sysdig.com

To see a live demo and meet some of the folks behind the project join us this Thursday for a Kubernetes and Sysdig Meetup in San Francisco.

    Creating a Raspberry Pi cluster running Kubernetes, the shopping list (Part 1)

    $
    0
    0
    At Devoxx Belgium and Devoxx Morocco, Ray Tsang and I showed a Raspberry Pi cluster we built at Quintor running HypriotOS, Docker and Kubernetes. For those who did not see the talks, you can check out an abbreviated version of the demo or the full talk by Ray on developing and deploying Java-based microservices in Kubernetes. While we received many compliments on the talk, the most common question was about how to build a Pi cluster themselves! We’ll be doing just that, in two parts. This first post will cover the shopping list for the cluster, and the second will show you how to get it up and running . . .

    Wait! Why the heck build a Raspberry Pi cluster running Kubernetes? 


    We had two big reasons to build the Pi cluster at Quintor. First of all we wanted to experiment with container technology at scale on real hardware. You can try out container technology using virtual machines, but Kubernetes runs great on on bare metal too. To explore what that’d be like, we built a Raspberry Pi cluster just like we would build a cluster of machines in a production datacenter. This allowed us to understand and simulate how Kubernetes would work when we move it to our data centers.

    Secondly, we did not want to blow the budget to do this exploration. And what is cheaper than a Raspberry Pi! If you want to build a cluster comprising many nodes, each node should have a good cost to performance ratio. Our Pi cluster has 20 CPU cores, which is more than many servers, yet cost us less than $400. Additionally, the total power consumption is low and the form factor is small, which is great for these kind of demo systems.

    So, without further ado, let’s get to the hardware.

    The Shopping List:

    5
    Raspberry Pi 2 model B
    5
    16 GB micro SD-card class 10
    ~ $45
    1
    D-Link Switch GO-SW-8E 8-Port
    ~ $15
    1
    Anker 60W 6-Port PowerPort USB Charger (white)
    ~ $35
    3
    ModMyPi Multi-Pi Stackable Raspberry Pi Case
    ~ $60
    1
    ModMyPi Multi-Pi Stackable Raspberry Pi Case - Bolt Pack
    ~ $7
    5
    Micro USB cable (white) 1ft long
    ~ $10
    5
    UTP cat5 cable (white) 1ft long
    ~ $10

    For a total of approximately $380 you will have a building set to create a Raspberry Pi cluster like we built! 1

    Some of our considerations 


    We used the Raspberry Pi 2 model B boards in our cluster rather than the Pi 1 boards because of the CPU power (quadcore @ 900MHz over a dualcore @ 700MHz) and available memory (1 GB over 512MB). These specs allowed us to run multiple containers on each Pi to properly experiment with Kubernetes.

    We opted for a 16GB SD-card in each Pi to be at the save side on filesystem storage. In hindsight, 8GB seemed to be enough.

    Note the GeauxRobot Stackable Case looks like an alternative for the ModMyPi Stackable Case, but it’s smaller which can cause a problem fitting in the Anker USB Adapter and placing the D-Link Network Switch. So, we stuck with the ModMyPi case.

    Putting it together 


    Building the Raspberry Pi cluster is pretty straight forward. Most of the work is putting the stackable casing together and mounting the Pi boards on the plexiglass panes. We mounted the network switch and USB Adapter using double side foam tape, which feels strong enough for most situations. Finally, we connected the USB and UTP cables. Next, we installed HypriotOS on every Pi. HypriotOS is a Raspbian based Linux OS for Raspberry Pi’s extended with Docker support. The Hypriot team has an excellent tutorial on Getting started with Docker on your Raspberry Pi. Follow this tutorial to get Linux and Docker running on all Pi’s.

    With that, you’re all set! Next up will be running Kubernetes on the Raspberry Pi cluster. We’ll be covering this the next post, so stay tuned!


    Arjen Wassink, Java Architect and Team Lead, Quintor


    1 To save ~$90 by making a stack of four Pi’s (instead of five). This also means you can use a 5-Port Anker USB Charger instead of the 6-Port one.


    How Weave built a multi-deployment solution for Scope using Kubernetes

    $
    0
    0
    Today we hear from Peter Bourgon, Software Engineer at Weaveworks, a company that provides software for developers to network, monitor and control microservices-based apps in docker containers. Peter tells us what was involved in selecting and deploying Kubernetes 

    Earlier this year at Weaveworks we launched Weave Scope, an open source solution for visualization and monitoring of containerised apps and services. Recently we released a hosted Scope service into an Early Access Program. Today, we want to walk you through how we initially prototyped that service, and how we ultimately chose and deployed Kubernetes as our platform.

    A cloud-native architecture 


    Scope already had a clean internal line of demarcation between data collection and user interaction, so it was straightforward to split the application on that line, distribute probes to customers, and host frontends in the cloud. We built out a small set of microservices in the 12-factor model, which includes:

    • A users service, to manage and authenticate user accounts 
    • A provisioning service, to manage the lifecycle of customer Scope instances 
    • A UI service, hosting all of the fancy HTML and JavaScript content 
    • A frontend service, to route requests according to their properties 
    • A monitoring service, to introspect the rest of the system 

    All services are built as Docker images, FROM scratch where possible. We knew that we wanted to offer at least 3 deployment environments, which should be as near to identical as possible. 

    • An "Airplane Mode" local environment, on each developer's laptop 
    • A development or staging environment, on the same infrastructure that hosts production, with different user credentials 
    • The production environment itself 

    These were our application invariants. Next, we had to choose our platform and deployment model.

    Our first prototype 

    There are a seemingly infinite set of choices, with an infinite set of possible combinations. After surveying the landscape in mid-2015, we decided to make a prototype with

    • Amazon EC2 as our cloud platform, including RDS for persistence 
    • Docker Swarm as our "scheduler" 
    • Consul for service discovery when bootstrapping Swarm 
    • Weave Net for our network and service discovery for the application itself 
    • Terraform as our provisioner 

    This setup was fast to define and fast to deploy, so it was a great way to validate the feasibility of our ideas. But we quickly hit problems. 

    • Terraform's support for Docker as a provisioner is barebones, and we uncovered some bugs when trying to use it to drive Swarm. 
    • Largely as a consequence of the above, managing a zero-downtime deploy of Docker containers with Terraform was very difficult. 
    • Swarm's raison d'être is to abstract the particulars of multi-node container scheduling behind the familiar Docker CLI/API commands. But we concluded that the API is insufficiently expressive for the kind of operations that are necessary at scale in production. 
    • Swarm provides no fault tolerance in the case of e.g. node failure. 

    We also made a number of mistakes when designing our workflow.

    • We tagged each container with its target environment at build time, which simplified our Terraform definitions, but effectively forced us to manage our versions via image repositories. That responsibility belongs in the scheduler, not the artifact store. 
    • As a consequence, every deploy required artifacts to be pushed to all hosts. This made deploys slow, and rollbacks unbearable. 
    • Terraform is designed to provision infrastructure, not cloud applications. The process is slower and more deliberate than we’d like. Shipping a new version of something to prod took about 30 minutes, all-in. 

    When it became clear that the service had potential, we re-evaluated the deployment model with an eye towards the long-term.

    Rebasing on Kubernetes 

    It had only been a couple of months, but a lot had changed in the landscape.


    While many of our problems could be fixed without making fundamental architectural changes, we wanted to capitalize on the advances in the industry, by joining an existing ecosystem, and leveraging the experience and hard work of its contributors. 

    After some internal deliberation, we did a small-scale audition of Nomad and Kubernetes. We liked Nomad a lot, but felt it was just too early to trust it with our production service. Also, we found the Kubernetes developers to be the most responsive to issues on GitHub. So, we decided to go with Kubernetes.

    Local Kubernetes 


    First, we would replicate our Airplane Mode local environment with Kubernetes. Because we have developers on both Mac and Linux laptops, it’s important that the local environment is containerised. So, we wanted the Kubernetes components themselves (kubelet, API server, etc.) to run in containers.

    We encountered two main problems. First, and most broadly, creating Kubernetes clusters from scratch is difficult, as it requires deep knowledge of how Kubernetes works, and quite some time to get the pieces to fall in place together. local-cluster-up.sh seems like a Kubernetes developer’s tool and didn’t leverage containers, and the third-party solutions we found, like Kubernetes Solo, require a dedicated VM or are platform-specific.

    Second, containerised Kubernetes is still missing several important pieces. Following the official Kubernetes Docker guide yields a barebones cluster without certificates or service discovery. We also encountered a couple of usability issues (#16586, #17157), which we resolved by submitting a patch and building our own hyperkube image from master.

    In the end, we got things working by creating our own provisioning script. It needs to do things like generate the PKI keys and certificates and provision the DNS add-on, which took a few attempts to get right. We’ve also learned of a commit to add certificate generation to the Docker build, so things will likely get easier in the near term.

    Kubernetes on AWS 


    Next, we would deploy Kubernetes to AWS, and wire it up with the other AWS components. We wanted to stand up the service in production quickly, and we only needed to support Amazon, so we decided to do so without Weave Net and to use a pre-existing provisioning solution. But we’ll definitely revisit this decision in the near future, leveraging Weave Net via Kubernetes plugins.

    Ideally we would have used Terraform resources, and we found a couple: kraken (using Ansible), kubestack (coupled to GCE), kubernetes-coreos-terraform (outdated Kubernetes) and coreos-kubernetes. But they all build on CoreOS, which was an extra moving part we wanted to avoid in the beginning. (On our next iteration, we’ll probably audition CoreOS.) If you use Ansible, there are playbooks available in the main repo. There are also community-drive Chef cookbooks and Puppet modules. I’d expect the community to grow quickly here.

    The only other viable option seemed to be kube-up, which is a collection of scripts that provision Kubernetes onto a variety of cloud providers. By default, kube-up onto AWS puts the master and minion nodes into their own VPC, or Virtual Private Cloud. But our RDS instances were provisioned in the region-default VPC, which meant that communication from a Kubernetes minion to the DB would be possible only via VPC peering or by opening the RDS VPC's firewall rules manually.

    To get traffic to traverse a VPC peer link, your destination IP needs to be in the target VPC's private address range. But it turns out that resolving the RDS instance's hostname from anywhere outside the same VPC will yield the public IP. And performing the resolution is important, because RDS reserves the right to change the IP for maintenance. This wasn't ever a concern in the previous infrastructure, because our Terraform scripts simply placed everything in the same VPC. So I thought I'd try the same with Kubernetes; the kube-up script ostensibly supports installing to an existing VPC by specifying a VPC_ID environment variable, so I tried installing Kubernetes to the RDS VPC. kube-up appeared to succeed, but service integration via ELBs broke and teardown via kube-down stopped working. After some time, we judged it best to let kube-up keep its defaults, and poked a hole in the RDS VPC.

    This was one hiccup among several that we encountered. Each one could be fixed in isolation, but the inherent fragility of using a shell script to provision remote state seemed to be the actual underlying cause. We fully expect the Terraform, Ansible, Chef, Puppet, etc. packages to continue to mature, and hope to switch soon.

    Provisioning aside, there are great things about the Kubernetes/AWS integration. For example, Kubernetes services of the correct type automatically generate ELBs, and Kubernetes does a great job of lifecycle management there. Further, the Kubernetes domain model—services, pods, replication controllers, the labels and selector model, and so on—is coherent, and seems to give the user the right amount of expressivity, though the definition files do tend to stutter needlessly. The kubectl tool is good, albeit daunting at first glance. The rolling-update command in particular is brilliant: exactly the semantics and behavior I'd expect from a system like this. Indeed, once Kubernetes was up and running, it just worked, and exactly as I expected it to. That’s a huge thing.

    Conclusions 


    After a couple weeks of fighting with the machines, we were able to resolve all of our integration issues, and have rolled out a reasonably robust Kubernetes-based system to production.

    • Provisioning Kubernetes is difficult, owing to a complex architecture and young provisioning story. This shows all signs of improving. 
    • Kubernetes’ non-optional security model takes time to get right
    • The Kubernetes domain language is a great match to the problem domain. 
    • We have a lot more confidence in operating our application (It's a lot faster, too.). 
    • And we're very happy to be part of a growing Kubernetes userbase, contributing issues and patches as we can and benefitting from the virtuous cycle of open-source development that powers the most exciting software being written today. 
     - Peter Bourgon, Software Engineer at Weaveworks

    Weave Scope is an open source solution for visualization and monitoring of containerised apps and services. For a hosted Scope service, request an invite to Early Access program at scope.weave.works.

    Managing Kubernetes Pods, Services and Replication Controllers with Puppet

    $
    0
    0
    Today’s guest post is written by Gareth Rushgrove, Senior Software Engineer at Puppet Labs, a leader in IT automation. Gareth tells us about a new Puppet module that helps manage resources in Kubernetes. 

    People familiar with Puppet might have used it for managing files, packages and users on host computers. But Puppet is first and foremost a configuration management tool, and config management is a much broader discipline than just managing host-level resources. A good definition of configuration management is that it aims to solve four related problems: identification, control, status accounting and verification and audit. These problems exist in the operation of any complex system, and with the new Puppet Kubernetes module we’re starting to look at how we can solve those problems for Kubernetes.

    The Puppet Kubernetes Module


    The Puppet Kubernetes module currently assumes you already have a Kubernetes cluster up and running. Its focus is on managing the resources in Kubernetes, like Pods, Replication Controllers and Services, not (yet) on managing the underlying kubelet or etcd services. Here’s a quick snippet of code describing a Pod in Puppet’s DSL.

    kubernetes_pod { 'sample-pod':
    ensure => present,
    metadata => {
    namespace => 'default',
    },
    spec => {
    containers => [{
    name => 'container-name',
    image => 'nginx',
    }]
    },
    }


    If you’re familiar with the YAML file format, you’ll probably recognise the structure immediately. The interface is intentionally identical to aid conversion between different formats — in fact, the code powering this is autogenerated from the Kubernetes API Swagger definitions. Running the above code, assuming we save it as pod.pp, is as simple as:

    puppet apply pod.pp

    Authentication uses the standard kubectl configuration file. You can find complete installation instructions in the module's README.

    Kubernetes has several resources, from Pods and Services to Replication Controllers and Service Accounts. You can see an example of the module managing these resources in the Kubernetes guestbook sample in Puppet post. This demonstrates converting the canonical hello-world example to use Puppet code.

    One of the main advantages of using Puppet for this, however, is that you can create your own higher-level and more business-specific interfaces to Kubernetes-managed applications. For instance, for the guestbook, you could create something like the following:

    guestbook { 'myguestbook':
    redis_slave_replicas => 2,
    frontend_replicas => 3,
    redis_master_image => 'redis',
    redis_slave_image => 'gcr.io/google_samples/gb-redisslave:v1',
    frontend_image => 'gcr.io/google_samples/gb-frontend:v3',
    }

    You can read more about using Puppet’s defined types, and see lots more code examples, in the Puppet blog post, Building Your Own Abstractions for Kubernetes in Puppet.

    Conclusions


    The advantages of using Puppet rather than just the standard YAML files and kubectl are:

    • The ability to create your own abstractions to cut down on repetition and craft higher-level user interfaces, like the guestbook example above. 
    • Use of Puppet’s development tools for validating code and for writing unit tests. 
    • Integration with other tools such as Puppet Server, for ensuring that your model in code matches the state of your cluster, and with PuppetDB for storing reports and tracking changes.
    • The ability to run the same code repeatedly against the Kubernetes API, to detect any changes or remediate configuration drift. 

    It’s also worth noting that most large organisations will have very heterogenous environments, running a wide range of software and operating systems. Having a single toolchain that unifies those discrete systems can make adopting new technology like Kubernetes much easier.

    It’s safe to say that Kubernetes provides an excellent set of primitives on which to build cloud-native systems. And with Puppet, you can address some of the operational and configuration management issues that come with running any complex system in production. Let us know what you think if you try the module out, and what else you’d like to see supported in the future.

     - Gareth Rushgrove, Senior Software Engineer, Puppet Labs
    Viewing all 290 articles
    Browse latest View live